
 Yahoo Finance
 The Return Trends At Almadex Minerals (CVE:DEX) Look Promising
Finding a business that has the potential to grow substantially is not easy, but it is possible if we look at a few key financial metrics. Typically, we'll want to notice a trend of growing return on capital employed (ROCE) and alongside that, an expanding base of capital employed. If you see this, it typically means it's a company with a great business model and plenty of profitable reinvestment opportunities. So on that note, Almadex Minerals (CVE:DEX) looks quite promising in regards to its trends of return on capital.
Return On Capital Employed (ROCE): What Is It?
For those who don't know, ROCE is a measure of a company's yearly pre-tax profit (its return), relative to the capital employed in the business. Analysts use this formula to calculate it for Almadex Minerals:
Return on Capital Employed = Earnings Before Interest and Tax (EBIT) ÷ (Total Assets - Current Liabilities)
0.036 = CA$1.0m ÷ (CA$29m - CA$391k) (Based on the trailing twelve months to March 2023).
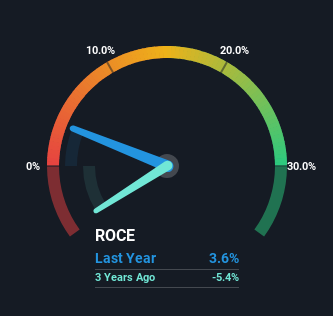
So, Almadex Minerals has an ROCE of 3.6%. In absolute terms, that's a low return but it's around the Metals and Mining industry average of 3.3%.
See our latest analysis for Almadex Minerals
While the past is not representative of the future, it can be helpful to know how a company has performed historically, which is why we have this chart above. If you want to delve into the historical earnings, revenue and cash flow of Almadex Minerals, check out these free graphs here.
How Are Returns Trending?
Almadex Minerals has recently broken into profitability so their prior investments seem to be paying off. About five years ago the company was generating losses but things have turned around because it's now earning 3.6% on its capital. Not only that, but the company is utilizing 103% more capital than before, but that's to be expected from a company trying to break into profitability. We like this trend, because it tells us the company has profitable reinvestment opportunities available to it, and if it continues going forward that can lead to a multi-bagger performance.
The Key Takeaway
In summary, it's great to see that Almadex Minerals has managed to break into profitability and is continuing to reinvest in its business. And given the stock has remained rather flat over the last five years, there might be an opportunity here if other metrics are strong. So researching this company further and determining whether or not these trends will continue seems justified.
One more thing: We've identified 4 warning signs with Almadex Minerals (at least 1 which shouldn't be ignored) , and understanding them would certainly be useful.
While Almadex Minerals isn't earning the highest return, check out this free list of companies that are earning high returns on equity with solid balance sheets.
Have feedback on this article? Concerned about the content? Get in touch with us directly. Alternatively, email editorial-team (at) simplywallst.com.
This article by Simply Wall St is general in nature. We provide commentary based on historical data and analyst forecasts only using an unbiased methodology and our articles are not intended to be financial advice. It does not constitute a recommendation to buy or sell any stock, and does not take account of your objectives, or your financial situation. We aim to bring you long-term focused analysis driven by fundamental data. Note that our analysis may not factor in the latest price-sensitive company announcements or qualitative material. Simply Wall St has no position in any stocks mentioned.
Join A Paid User Research Session
You’ll receive a US$30 Amazon Gift card for 1 hour of your time while helping us build better investing tools for the individual investors like yourself. Sign up here
