
 Yahoo Finance
 These Return Metrics Don't Make Synectics (LON:SNX) Look Too Strong
What underlying fundamental trends can indicate that a company might be in decline? When we see a declining return on capital employed (ROCE) in conjunction with a declining base of capital employed, that's often how a mature business shows signs of aging. This indicates the company is producing less profit from its investments and its total assets are decreasing. On that note, looking into Synectics (LON:SNX), we weren't too upbeat about how things were going.
Return On Capital Employed (ROCE): What Is It?
For those that aren't sure what ROCE is, it measures the amount of pre-tax profits a company can generate from the capital employed in its business. The formula for this calculation on Synectics is:
Return on Capital Employed = Earnings Before Interest and Tax (EBIT) ÷ (Total Assets - Current Liabilities)
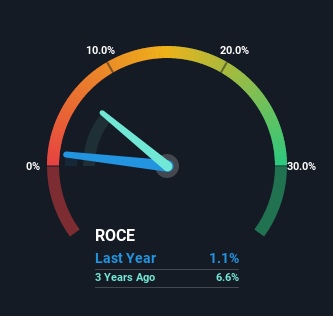
0.011 = UK£422k ÷ (UK£54m - UK£15m) (Based on the trailing twelve months to May 2022).
Thus, Synectics has an ROCE of 1.1%. Ultimately, that's a low return and it under-performs the Electronic industry average of 10%.
View our latest analysis for Synectics
In the above chart we have measured Synectics' prior ROCE against its prior performance, but the future is arguably more important. If you're interested, you can view the analysts predictions in our free report on analyst forecasts for the company.
What Can We Tell From Synectics' ROCE Trend?
In terms of Synectics' historical ROCE movements, the trend doesn't inspire confidence. Unfortunately the returns on capital have diminished from the 9.4% that they were earning five years ago. Meanwhile, capital employed in the business has stayed roughly the flat over the period. Companies that exhibit these attributes tend to not be shrinking, but they can be mature and facing pressure on their margins from competition. If these trends continue, we wouldn't expect Synectics to turn into a multi-bagger.
On a related note, Synectics has decreased its current liabilities to 28% of total assets. So we could link some of this to the decrease in ROCE. What's more, this can reduce some aspects of risk to the business because now the company's suppliers or short-term creditors are funding less of its operations. Since the business is basically funding more of its operations with it's own money, you could argue this has made the business less efficient at generating ROCE.
What We Can Learn From Synectics' ROCE
In summary, it's unfortunate that Synectics is generating lower returns from the same amount of capital. It should come as no surprise then that the stock has fallen 45% over the last five years, so it looks like investors are recognizing these changes. With underlying trends that aren't great in these areas, we'd consider looking elsewhere.
On a final note, we found 3 warning signs for Synectics (1 is a bit unpleasant) you should be aware of.
If you want to search for solid companies with great earnings, check out this free list of companies with good balance sheets and impressive returns on equity.
Have feedback on this article? Concerned about the content? Get in touch with us directly. Alternatively, email editorial-team (at) simplywallst.com.
This article by Simply Wall St is general in nature. We provide commentary based on historical data and analyst forecasts only using an unbiased methodology and our articles are not intended to be financial advice. It does not constitute a recommendation to buy or sell any stock, and does not take account of your objectives, or your financial situation. We aim to bring you long-term focused analysis driven by fundamental data. Note that our analysis may not factor in the latest price-sensitive company announcements or qualitative material. Simply Wall St has no position in any stocks mentioned.
Join A Paid User Research Session
You’ll receive a US$30 Amazon Gift card for 1 hour of your time while helping us build better investing tools for the individual investors like yourself. Sign up here
