
 Yahoo Finance
 Bank of America's recent card data conflicts with the market's read on consumers

Bank of America Merrill Lynch (BAML) analysts, led by Michelle Meyer, have analyzed the credit and debit card spending data of Bank of America’s customers, and concluded that the recent retail sales boom may be set to hit a bit of a speed bump.
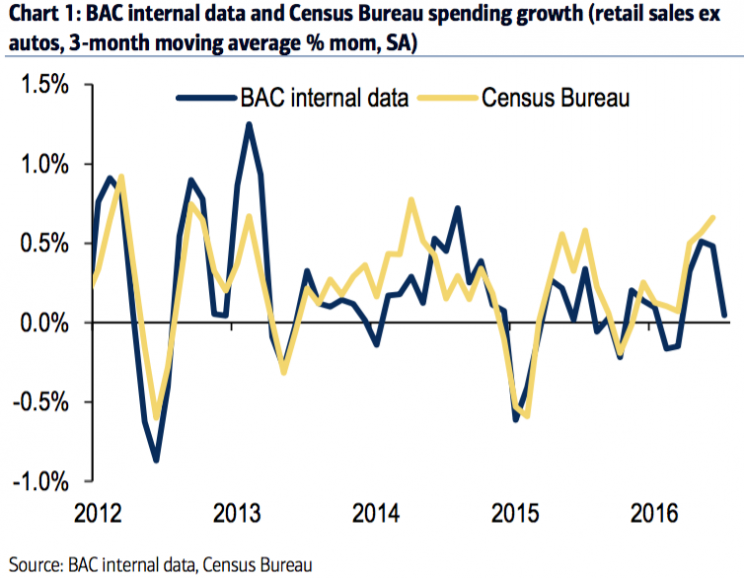
Right now, economists are expecting the Census Bureau to report that July retail sales (minus auto sales) grew by 0.1% month over month. However, Bank of America’s card data indicates that consumer spending actually decreased by 0.3% from June. In general, this card data has had a fairly strong correlation with actual Census Bureau retail sales data, which can be seen below:
However, that isn’t all that BAML found from analyzing the card data; investors also seem to be misjudging the sectors that people are spending their money in.
More specifically, “it appears as though market participants have been too negative on discretionary spending relative to actual spend and have been too positive on the prospects for staples,” comments Meyer. BAML considers things like clothing, entertainment, durables and specialty retailers to fall under discretionary spending, while groceries and general merchandise are considered staples.
Essentially, Meyer looked at how much people are spending in these two categories, and then compared it to how well the S&P index that tracks the corresponding sector was doing.
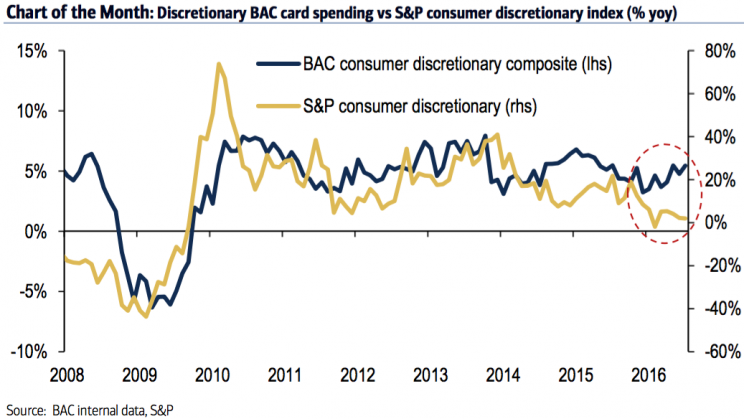
While Bank of America’s card data is showing between 20% and 40% year-over-year growth for consumer discretionary, the S&P consumer discretionary index is essentially flat year over year. The growth in the card data has also been picking up in recent months.
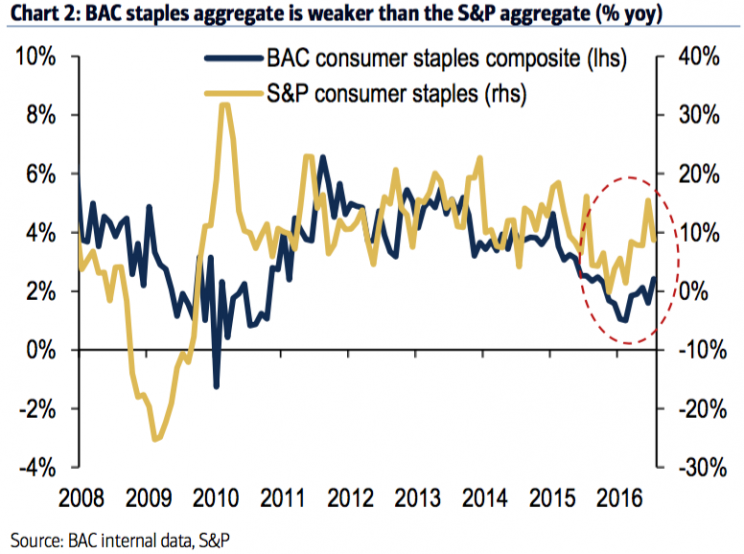
On the other hand, Bank of America’s card data shows flat sales for consumer staples, while the S&P consumer staples index is 10% up.
This is a bit surprising; often, when retail sales slip, discretionary spending is one of the first sectors to get hit, since this sector has more consumer ‘wants’, while the staples sector generally contains consumer ‘needs.’
Regardless, the recent divergence between the card data and index performance is something that investors should pay attention to. Of course, there are more factors that affect stock prices than growth rates, but Meyer notes that “BAC aggregates for discretionary and staples spending historically trend with the S&P indices.” This trend breaking may just be an unimportant exception or the new norm, but it could also represent a golden opportunity traders.
—
Rayhanul Ibrahim is a writer for Yahoo Finance.
Read more:
Why plunging asphalt prices haven’t sparked an infrastructure boom
Apple is single-handedly bringing down tech sector profits
From biomass to nuclear: The evolution of American energy usage since 1776
How pros are advising clients in this bizarre world of negative rates
As the stock market hits new highs, Wall Street is getting more skeptical
