
 Yahoo Finance
 Renergen Limited's (JSE:REN) Shift From Loss To Profit
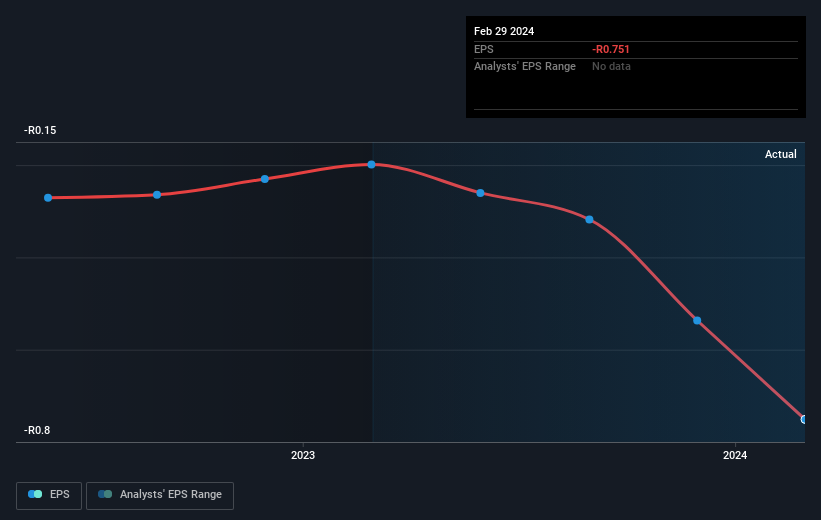
We feel now is a pretty good time to analyse Renergen Limited's (JSE:REN) business as it appears the company may be on the cusp of a considerable accomplishment. Renergen Limited, an investment holding company, engages in the alternative and renewable energy businesses in South Africa and sub-Saharan Africa. The R1.3b market-cap company announced a latest loss of R110m on 29 February 2024 for its most recent financial year result. The most pressing concern for investors is Renergen's path to profitability – when will it breakeven? We've put together a brief outline of industry analyst expectations for the company, its year of breakeven and its implied growth rate.
View our latest analysis for Renergen
Renergen is bordering on breakeven, according to some South African Oil and Gas analysts. They anticipate the company to incur a final loss in 2026, before generating positive profits of R642m in 2027. So, the company is predicted to breakeven approximately 3 years from now. How fast will the company have to grow each year in order to reach the breakeven point by 2027? Working backwards from analyst estimates, it turns out that they expect the company to grow 114% year-on-year, on average, which is rather optimistic! Should the business grow at a slower rate, it will become profitable at a later date than expected.
Given this is a high-level overview, we won’t go into details of Renergen's upcoming projects, however, keep in mind that by and large energy companies, depending on the stage of operation and resource produced, have irregular periods of cash flow. This means that a high growth rate is not unusual, especially if the company is currently in an investment period.
Before we wrap up, there’s one issue worth mentioning. Renergen currently has a relatively high level of debt. Generally, the rule of thumb is debt shouldn’t exceed 40% of your equity, which in Renergen's case is 94%. A higher level of debt requires more stringent capital management which increases the risk around investing in the loss-making company.
Next Steps:
There are too many aspects of Renergen to cover in one brief article, but the key fundamentals for the company can all be found in one place – Renergen's company page on Simply Wall St. We've also compiled a list of pertinent aspects you should further research:
Historical Track Record: What has Renergen's performance been like over the past? Go into more detail in the past track record analysis and take a look at the free visual representations of our analysis for more clarity.
Management Team: An experienced management team on the helm increases our confidence in the business – take a look at who sits on Renergen's board and the CEO’s background.
Other High-Performing Stocks: Are there other stocks that provide better prospects with proven track records? Explore our free list of these great stocks here.
Have feedback on this article? Concerned about the content? Get in touch with us directly. Alternatively, email editorial-team (at) simplywallst.com.
This article by Simply Wall St is general in nature. We provide commentary based on historical data and analyst forecasts only using an unbiased methodology and our articles are not intended to be financial advice. It does not constitute a recommendation to buy or sell any stock, and does not take account of your objectives, or your financial situation. We aim to bring you long-term focused analysis driven by fundamental data. Note that our analysis may not factor in the latest price-sensitive company announcements or qualitative material. Simply Wall St has no position in any stocks mentioned.
Have feedback on this article? Concerned about the content? Get in touch with us directly. Alternatively, email editorial-team@simplywallst.com
