
 Yahoo Finance
 Reko International Group (CVE:REKO) Will Be Hoping To Turn Its Returns On Capital Around
When it comes to investing, there are some useful financial metrics that can warn us when a business is potentially in trouble. Typically, we'll see the trend of both return on capital employed (ROCE) declining and this usually coincides with a decreasing amount of capital employed. This reveals that the company isn't compounding shareholder wealth because returns are falling and its net asset base is shrinking. So after glancing at the trends within Reko International Group (CVE:REKO), we weren't too hopeful.
Understanding Return On Capital Employed (ROCE)
For those who don't know, ROCE is a measure of a company's yearly pre-tax profit (its return), relative to the capital employed in the business. Analysts use this formula to calculate it for Reko International Group:
Return on Capital Employed = Earnings Before Interest and Tax (EBIT) ÷ (Total Assets - Current Liabilities)
0.011 = CA$568k ÷ (CA$62m - CA$8.7m) (Based on the trailing twelve months to January 2024).
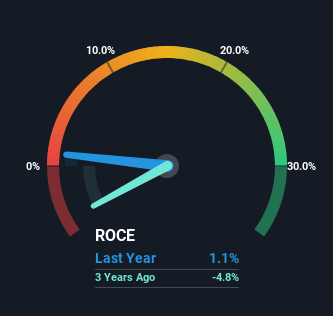
Thus, Reko International Group has an ROCE of 1.1%. In absolute terms, that's a low return and it also under-performs the Machinery industry average of 11%.
View our latest analysis for Reko International Group
While the past is not representative of the future, it can be helpful to know how a company has performed historically, which is why we have this chart above. If you want to delve into the historical earnings , check out these free graphs detailing revenue and cash flow performance of Reko International Group.
So How Is Reko International Group's ROCE Trending?
We are a bit worried about the trend of returns on capital at Reko International Group. About five years ago, returns on capital were 3.9%, however they're now substantially lower than that as we saw above. Meanwhile, capital employed in the business has stayed roughly the flat over the period. This combination can be indicative of a mature business that still has areas to deploy capital, but the returns received aren't as high due potentially to new competition or smaller margins. If these trends continue, we wouldn't expect Reko International Group to turn into a multi-bagger.
What We Can Learn From Reko International Group's ROCE
In summary, it's unfortunate that Reko International Group is generating lower returns from the same amount of capital. However the stock has delivered a 60% return to shareholders over the last five years, so investors might be expecting the trends to turn around. Regardless, we don't feel too comfortable with the fundamentals so we'd be steering clear of this stock for now.
One more thing: We've identified 4 warning signs with Reko International Group (at least 1 which shouldn't be ignored) , and understanding them would certainly be useful.
If you want to search for solid companies with great earnings, check out this free list of companies with good balance sheets and impressive returns on equity.
Have feedback on this article? Concerned about the content? Get in touch with us directly. Alternatively, email editorial-team (at) simplywallst.com.
This article by Simply Wall St is general in nature. We provide commentary based on historical data and analyst forecasts only using an unbiased methodology and our articles are not intended to be financial advice. It does not constitute a recommendation to buy or sell any stock, and does not take account of your objectives, or your financial situation. We aim to bring you long-term focused analysis driven by fundamental data. Note that our analysis may not factor in the latest price-sensitive company announcements or qualitative material. Simply Wall St has no position in any stocks mentioned.
