
 Yahoo Finance
 Regency Centers (REG) Q1 FFO Meets Estimates, Revenues Miss
Regency Centers Corporation’s REG first-quarter 2020 NAREIT funds from operations (FFO) per share of 98 cents were in line with the Zacks Consensus Estimate. The reported figure was 3.2% higher than the prior-year quarter’s 95 cents.
Decent leasing activities and rent spreads aided performance. However, results indicate declines in revenues and same-property net operating income (NOI).
Total revenues in the quarter were $283.7 million, lagging the Zacks Consensus Estimate of $288.1 million. Further, the top line declined marginally from the year-ago figure of $286.3 million.
Inside the Headlines
During the reported quarter, Regency Centers executed 1.5 million square feet of comparable new and renewal leases, with blended rent spreads for the March-end quarter of 4.1%.
As of Mar 31, 2020, the company’s wholly-owned portfolio along with its pro-rata shares of co-investment partnerships was 94.5% leased. Its same-property portfolio was 95% leased. Same-property NOI, excluding termination fees, edged down 0.7% on a year-over-year basis.
Portfolio Activity
During the reported quarter, the company sold two shopping centers for $98.4 million.
Further, in January 2020, it closed the acquisition of additional interests in two properties for $60.5 million.
Liquidity Update
Regency Centers’ liquidity totaled $1.3 billion as of Mar 31, 2020, consisting of cash balance of $735 million and $545 million available under its revolving credit facility. The company has no unsecured debt maturities until 2022.
During the quarter, in its efforts to provide financial flexibility and strengthen its balance-sheet position amid the ongoing pandemic, the company settled its 2019 forward equity sales under its at-the-market program (“ATM”), generating $125.8 million in net proceeds. It also drew an additional $500 million from its existing $1.25-billion revolving credit facility.
Dividend Update
On May 4, 2020, Regency Centers’ board of directors announced a quarterly cash dividend of 59.5 cents per share on its common stock. The dividend will be paid out on May 26 to shareholders of record as of May 2020.
Conclusion
For first-quarter 2020, Regency Centers’ same-property NOI was impacted by known bankruptcy move-outs and a higher uncollectible lease income due to the COVID-19 pandemic.
Notably, 416 properties of the company were operational in the first quarter amid the virus outbreak. However, due to social distancing mandates and the COVID-19 outbreak-related restrictions, around 40% of Regency Centers’ tenants were closed (based on pro-rata annual base rent) as of April end. Also, through May 5, 2020, 62% of April 2020 pro-rata base rents were collected.
Regency Centers Corporation Price, Consensus and EPS Surprise
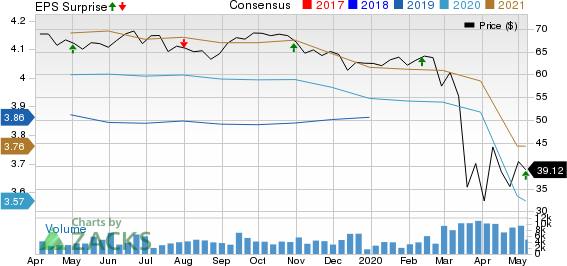
Regency Centers Corporation price-consensus-eps-surprise-chart | Regency Centers Corporation Quote
Regency Centers currently carries a Zacks Rank #4 (Sell).
You can see the complete list of today’s Zacks #1 Rank (Strong Buy) stocks here.
Performance of Other REITs
SL Green Realty Corp. SLG reported first-quarter 2020 FFO per share of $2.08, surpassing the Zacks Consensus Estimate of $1.70. The figure also compared favorably with the year-ago quarter’s $1.68.
Essex Property Trust Inc. ESS reported first-quarter 2020 core FFO per share of $3.48, surpassing the Zacks Consensus Estimate of $3.40. The figure also improved 7.7% from the year-ago quarter’s $3.23.
Vornado Realty Trust VNO reported first-quarter 2020 FFO plus assumed conversions as adjusted of 72 cents per share, missing the Zacks Consensus Estimate of 76 cents. The reported figure declined 8.9% year over year.
Note: Anything related to earnings presented in this write-up represents funds from operations (FFO) — a widely used metric to gauge the performance of REITs.
Biggest Tech Breakthrough in a Generation
Be among the early investors in the new type of device that experts say could impact society as much as the discovery of electricity. Current technology will soon be outdated and replaced by these new devices. In the process, it’s expected to create 22 million jobs and generate $12.3 trillion in activity.
A select few stocks could skyrocket the most as rollout accelerates for this new tech. Early investors could see gains similar to buying Microsoft in the 1990s. Zacks’ just-released special report reveals 8 stocks to watch. The report is only available for a limited time.
See 8 breakthrough stocks now>>
Want the latest recommendations from Zacks Investment Research? Today, you can download 7 Best Stocks for the Next 30 Days. Click to get this free report
Vornado Realty Trust (VNO) : Free Stock Analysis Report
Regency Centers Corporation (REG) : Free Stock Analysis Report
SL Green Realty Corporation (SLG) : Free Stock Analysis Report
Essex Property Trust Inc (ESS) : Free Stock Analysis Report
To read this article on Zacks.com click here.
Zacks Investment Research
