
 Yahoo Finance
 Reflecting on Computer Modelling Group's (TSE:CMG) Share Price Returns Over The Last Five Years
While it may not be enough for some shareholders, we think it is good to see the Computer Modelling Group Ltd. (TSE:CMG) share price up 18% in a single quarter. But that doesn't change the fact that the returns over the last five years have been less than pleasing. In fact, the share price is down 44%, which falls well short of the return you could get by buying an index fund.
See our latest analysis for Computer Modelling Group
While markets are a powerful pricing mechanism, share prices reflect investor sentiment, not just underlying business performance. One way to examine how market sentiment has changed over time is to look at the interaction between a company's share price and its earnings per share (EPS).
During the five years over which the share price declined, Computer Modelling Group's earnings per share (EPS) dropped by 5.2% each year. Readers should note that the share price has fallen faster than the EPS, at a rate of 11% per year, over the period. This implies that the market was previously too optimistic about the stock.
You can see below how EPS has changed over time (discover the exact values by clicking on the image).
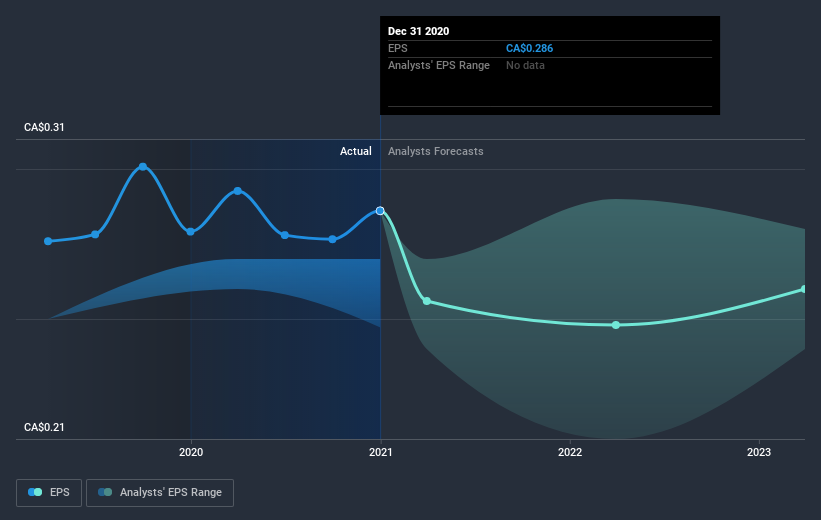
Before buying or selling a stock, we always recommend a close examination of historic growth trends, available here.
What About Dividends?
As well as measuring the share price return, investors should also consider the total shareholder return (TSR). The TSR incorporates the value of any spin-offs or discounted capital raisings, along with any dividends, based on the assumption that the dividends are reinvested. Arguably, the TSR gives a more comprehensive picture of the return generated by a stock. In the case of Computer Modelling Group, it has a TSR of -29% for the last 5 years. That exceeds its share price return that we previously mentioned. This is largely a result of its dividend payments!
A Different Perspective
Computer Modelling Group provided a TSR of 38% over the last twelve months. But that was short of the market average. On the bright side, that's still a gain, and it is certainly better than the yearly loss of about 5% endured over half a decade. So this might be a sign the business has turned its fortunes around. While it is well worth considering the different impacts that market conditions can have on the share price, there are other factors that are even more important. Consider for instance, the ever-present spectre of investment risk. We've identified 3 warning signs with Computer Modelling Group (at least 1 which is a bit concerning) , and understanding them should be part of your investment process.
But note: Computer Modelling Group may not be the best stock to buy. So take a peek at this free list of interesting companies with past earnings growth (and further growth forecast).
Please note, the market returns quoted in this article reflect the market weighted average returns of stocks that currently trade on CA exchanges.
This article by Simply Wall St is general in nature. It does not constitute a recommendation to buy or sell any stock, and does not take account of your objectives, or your financial situation. We aim to bring you long-term focused analysis driven by fundamental data. Note that our analysis may not factor in the latest price-sensitive company announcements or qualitative material. Simply Wall St has no position in any stocks mentioned.
Have feedback on this article? Concerned about the content? Get in touch with us directly. Alternatively, email editorial-team (at) simplywallst.com.
