
 Yahoo Finance
 Red Pine Continues to Intercept Significant Mineralization at the Wawa Gold Project, including 4.53 g/t over 11.53 metres including 15.00 g/t gold over 1.14 metres

TORONTO, April 03, 2024 (GLOBE NEWSWIRE) -- Red Pine Exploration Inc. (TSXV: RPX, OTCQB: RDEXF) (“Red Pine” or the “Company”) is pleased to announce assay results from 14 drill holes representing 5,390 metres (“m”) of diamond drilling from the 2023-2024 resource expansion program at the Wawa Gold Project. The drilling continues the program commenced in 2021 with a total of (“121”) drill holes for ~54,800 m having now been completed and released from the current targeted program of approximately 65,000 to 70,000 metres of resource expansion drilling leading to an updated resource estimate.
Drilling Highlights:
Contained within the Jubilee Shear System (Table 1)
4.53 grams per tonne (“g/t”) gold over 11.53 m, including 15.00 g/t gold over 1.14 m in SD-24-495
4.96 g/t gold over 7.87 m, including 16.50 g/t gold over 0.97 m in SD-24-490 (partial result)
3.40 g/t gold over 7.27 m, including 9.71 g/t gold over 2.04 m in SD-23-486
2.08 g/t gold over 6.32 m, including 8.16 g/t gold over 1.08 m in SD-23-481
2.19 g/t gold over 17.12 m, including 7.86 g/t gold over 2.10 m in SD-23-480
3.42 g/t gold over 10.11 m, including 9.22 g/t gold over 2.14 m in SD-23-479
Contained within the Hanging Wall of the Jubilee Shear (Table 2)
13.3 g/t over 1.22 m in SD-23-478
2.05 g/t over 6.01 m, including 5.61 g/t gold over 0.99 m in SD-24-490
Jean-Francois Montreuil, Vice President, Exploration of Red Pine commented:
“Our focused drilling campaign continues to yield positive results. The program continues to intersect gold mineralization within and away from the Jubilee Shear, the host of the current underground Surluga mineral resource¹. The latest drill results have intersected significant gold mineralization in the hanging wall of the Jubilee Shear and could contribute to reducing the stripping ratio under a proposed open pit scenario. The intersection of significant gold mineralization below the Jubilee Shear will potentially expand the resource to the north-west. Any possible open pit resource would also include gold mineralization at lower grades than the cut-off of the 2019 underground resource¹. The drill program also continues to expand the footprints of significant mineralization in the Jubilee Shear, which is expected to have a positive impact on a future resource.”
Table 1 – In and below the Jubilee Shear System (Figures 1 and 2) | |||||
Hole | From | To | Length | Gold | Zone |
(#) | (m) | (m) | (m)* | (g/t) | (name) |
SD-23-468 | 268.62 | 271.01 | 2.39 | 1.54 | Jubilee Shear |
278.40 | 286.17 | 7.77 | 0.93 | ||
SD-23-475 | 268.79 | 281.07 | 12.28 | 1.07 | |
306.51 | 308.77 | 2.26 | 2.18 | Shear Zone (below Jubilee Shear) | |
380.32 | 381.62 | 1.30 | 2.40 | ||
SD-23-478 | 360.27 | 364.78 | 4.51 | 1.00 | Shear Zone (below Jubilee Shear) |
SD-23-479 | 259.13 | 269.24 | 10.11 | 3.42 | Jubilee Shear (verification drilling) |
Including | |||||
263.07 | 264.14 | 2.14 | 9.22 | ||
SD-23-480 | 291.30 | 308.42 | 17.12 | 2.19 | Jubilee Shear (verification drilling) |
Including | |||||
291.30 | 292.31 | 1.01 | 4.65 | ||
305.12 | 307.22 | 2.10 | 7.86 | ||
SD-23-481 | 216.60 | 217.80 | 1.20 | 2.32 | Jubilee Shear |
321.08 | 327.40 | 6.32 | 2.08 | Shear Zone (below Jubilee Shear) | |
Including | |||||
321.08 | 322.20 | 1.12 | 3.04 | ||
326.32 | 327.40 | 1.08 | 8.16 | ||
SD-23-482 | 213.70 | 214.95 | 1.25 | 1.01 | Jubilee Shear |
219.45 | 220.62 | 1.17 | 0.45 | ||
235.62 | 238.92 | 3.30 | 0.97 | ||
303.60 | 304.70 | 1.10 | 8.55 | Shear Zone (below Jubilee Shear) | |
SD-23-483 | 244.35 | 247.31 | 2.96 | 0.43 | Jubilee Shear |
258.57 | 259.60 | 1.03 | 0.69 | ||
281.10 | 292.90 | 11.80 | 1.52 | ||
Including | |||||
282.18 | 283.40 | 1.22 | 6.66 | ||
291.67 | 292.90 | 1.23 | 4.55 | ||
SD-23-484 | 201.69 | 207.10 | 5.41 | 0.91 | Jubilee Shear |
227.20 | 228.41 | 1.21 | 1.29 | ||
350.13 | 352.82 | 2.69 | 0.93 | Shear Zone (below Jubilee Shear) | |
SD-23-485 | 260.24 | 261.20 | 0.96 | 0.61 | Jubilee Shear |
294.98 | 297.06 | 2.08 | 5.39 | ||
Including | |||||
294.98 | 295.98 | 1.00 | 11.00 | ||
SD-23-486 | 206.84 | 209.12 | 2.28 | 2.57 | Jubilee Shear |
Including | |||||
206.84 | 208.00 | 1.16 | 4.00 | ||
229.20 | 236.47 | 7.27 | 3.40 | ||
Including | |||||
232.40 | 234.44 | 2.04 | 9.71 | ||
SD-24-490 | 200.03 | 207.9 | 7.87 | 4.96 | Jubilee Shear (partial results) |
Including | |||||
200.03 | 201.00 | 0.97 | 16.50 | ||
203.51 | 204.62 | 1.11 | 7.46 | ||
SD-24-494 | 186.81 | 196.66 | 9.85 | 1.65 | Jubilee Shear |
Including | |||||
186.81 | 190.50 | 3.69 | 2.17 | ||
194.25 | 196.66 | 2.41 | 2.60 | ||
201.53 | 204.12 | 2.59 | 1.20 | ||
SD-23-495 | 188.91 | 193.21 | 4.12 | 0.41 | Jubilee Shear |
199.75 | 211.28 | 11.53 | 4.53 | ||
Including | |||||
199.75 | 202.68 | 2.93 | 5.41 | ||
203.77 | 204.88 | 1.11 | 5.13 | ||
206.14 | 208.18 | 2.04 | 4.99 | ||
210.14 | 211.28 | 1.14 | 15.00 | ||
250.26 | 252.94 | 2.68 | 0.51 | Shear Zone (below Jubilee Shear) | |
*Intercepts are calculated using a 0.4 g/t gold cut-off and a maximum of 5 m of internal dilution with no capping applied and are reported over core lengths. True width is estimated to vary between 75 to 95% of the reported core length. | |||||
Table 2 – Hanging wall of the Jubilee Shear (Figures 1 and 2) | |||||
Hole | From | To | Length | Gold | Zone |
(#) | (m) | (m) | (m)* | (g/t) | (name) |
SD-23-468 | 67.50 | 74.60 | 7.10 | 0.51 | Sheared Intrusion-related gold |
118.50 | 119.70 | 1.20 | 0.48 | Shear Zone | |
189.75 | 200.84 | 11.09 | 0.48 | Minto B | |
206.12 | 207.12 | 1.00 | 0.49 | ||
211.15 | 214.21 | 3.06 | 0.44 | ||
225.00 | 228.16 | 3.16 | 0.47 | ||
244.80 | 251.75 | 6.95 | 0.41 | ||
SD-23-478 | 43.88 | 45.22 | 1.34 | 0.97 | Shear Zone |
53.28 | 54.60 | 1.32 | 0.62 | Shear Zone | |
237.31 | 238.53 | 1.22 | 13.30 | Shear Zone | |
SD-23-479 | 104.71 | 105.87 | 1.16 | 0.66 | Shear Zone |
SD-23-480 | 15.49 | 16.96 | 1.47 | 0.79 | Shear Zone |
101.19 | 103.87 | 2.68 | 0.51 | Minto B | |
SD-23-482 | 196.88 | 198.00 | 1.12 | 1.46 | Shear Zone |
SD-23-483 | 93.78 | 94.86 | 1.08 | 0.63 | Minto B |
122.67 | 130.80 | 8.13 | 0.64 | Minto B | |
Including | |||||
123.62 | 124.57 | 0.95 | 3.42 | ||
SD-23-484 | 188.83 | 189.96 | 1.13 | 0.99 | Shear Zone |
SD-23-485 | 58.18 | 60.51 | 2.33 | 0.43 | Minto B |
SD-24-490 | 140.11 | 146.12 | 6.01 | 2.05 | Vein Network |
Including | |||||
142.12 | 143.11 | 0.99 | 5.61 | ||
SD-24-494 | 64.02 | 66.78 | 2.76 | 0.47 | Shear Zone |
*Intercepts are calculated using a 0.40 g/t gold cut-off grade and a maximum of 5 m of internal dilution with no capping applied and are reported over core lengths. True width is estimated to vary between 40 to 90% of the reported core length depending on the mineralization types defining the intersected gold zones. | |||||
| |||||
Discussion of Drill Results
In the hanging wall of the Jubilee Shear, the new results:
extend the footprints of gold mineralization in the Minto B Shear;
confirm the presence multiple mineralized shear zones above the Jubilee Shear; and
confirm the presence of extensional vein network(s) spatially above the 2019 resource in the Jubilee Shear and between the new shear zones.
The on-going drilling program and the new assay results also improve the understanding of the geometry and continuity of the zones of gold mineralization located above the Jubilee Shear for their inclusion in the resource update.
In the Jubilee Shear System, the new results:
increase the size and improve the continuity of gold mineralization >= 2 g/t gold in the main segment of the Jubilee Shear and between the new shear zones; and
confirm the presence of gold-mineralized shear zones that are parallel and located below the main zone of the Jubilee Shear that is hosting the 2019 resource.
The on-going drilling program continues to widen the footprints of the mineralized system centered on the Jubilee Shear System beyond the footprints of the 2019 resource¹. It shows that mineralization of significance and with indications of continuity is present in shear zones below the Jubilee Shear.
Quality Assurance/Quality Control ("QA/QC") Measures
Drill core samples were transported in security sealed bags for analyses to Actlabs in Ancaster, Ontario. Individual samples were labelled, placed in plastic sample bags and sealed. Groups of samples were then placed into durable rice bags and shipped. The residual coarse reject portions of the samples remain in storage if further work or verification is needed.
Red Pine has implemented a quality-control program to comply with best practices in the sampling and analysis of drill core. As part of its QA/QC program, Red Pine inserts external gold standards (low to high grade) and blanks every 20 samples in addition to random standards, blanks, and duplicates.
Qualified Person
Jean-Francois Montreuil, P.Geo. and Vice President, Exploration of Red Pine and the Qualified Person, as defined by National Instrument 43-101, has reviewed and approved the technical information contained in this news release.
About Red Pine Exploration Inc.
Red Pine Exploration Inc. is a gold exploration company headquartered in Toronto, Ontario, Canada. The Company's shares trade on the TSX Venture Exchange under the symbol “RPX” and on the OTCQB Markets under the symbol “RDEXF”.
The Wawa Gold Project is in the Michipicoten Greenstone Belt of Ontario, a region that has seen major investment by several producers in the last five years. Its land package hosts numerous historic gold mines and is over 6,900 hectares in size. Red Pine is building a strong position as a major mineral exploration and development player in the Michipicoten region.
For more information about the Company, visit www.redpineexp.com
Or contact:
Paul Martin, Board Chair and Interim CEO, at (416) 364-7024 or pmartin@redpineexp.com
Or
Carrie Howes, Director Corporate Communications, at (416) 644-7375 or chowes@redpineexp.com
¹ National Instrument 43-101 Technical Report for the Wawa Gold Project, Brian Thomas P.Geo. Golder Associates Ltd, report effective August 18, 2021.
Neither TSX Venture Exchange nor its Regulation Services Provider (as that term is defined in policies of the TSX Venture Exchange) accepts responsibility for the adequacy or accuracy of this release.
Cautionary Note Regarding Forward-Looking Information
This news release contains statements which constitute “forward-looking information” within the meaning of applicable securities laws, including statements regarding the plans, intentions, beliefs and current expectations of the Company with respect to future business activities and operating performance.
Forward-looking information is often identified by the words “may”, “would”, “could”, “should”, “will”, “intend”, “plan”, “anticipate”, “believe”, “estimate”, “expect” or similar expressions. Forward-looking information contained in this news release includes, but may not be limited to, statements regarding an updated resource estimate, a possible open pit resource, the potential of a reduced stripping ratio under a proposed open pit scenario, potentially expanding the resource to the north-west, and continuing to expand the footprints of significant mineralization in the Jubilee Shear which is expected to have a positive impact on a future resource. Investors are cautioned that forward-looking information is not based on historical facts but instead reflects management’s expectations, estimates or projections concerning future results or events based on the opinions, assumptions and estimates of management considered reasonable at the date the statements are made. Such opinions, assumptions and estimates are inherently subject to a variety of risks and uncertainties that could cause actual events or results to differ materially from those projected and undue reliance should not be placed on such information, as unknown or unpredictable factors could have material adverse effects on future results, performance or achievements. Among the key factors that could cause actual results to differ materially from those projected in the forward-looking information are: the Company's expectations in connection with the projects and exploration programs being met, the impact of general business and economic conditions, global liquidity and credit availability on the timing of cash flows and the values of assets and liabilities based on projected future conditions, fluctuating gold prices, currency exchange rates (such as the Canadian dollar versus the United States Dollar), variations in ore grade or recovery rates, changes in accounting policies, changes in the Company's mineral reserves and resources, changes in project parameters as plans continue to be refined, changes in project development, construction, production and commissioning time frames, the possibility of project cost overruns or unanticipated costs and expenses, higher prices for fuel, power, labour and other consumables contributing to higher costs and general risks of the mining industry, failure of plant, equipment or processes to operate as anticipated, unexpected changes in mine life, seasonality and weather, costs and timing of the development of new deposits, success of exploration activities, permitting time lines, government regulation of mining operations, environmental risks, unanticipated reclamation expenses, title disputes or claims, and limitations on insurance.
This information contained in this news release is qualified in its entirety by cautionary statements and risk factor disclosure contained in filings made by the Company, including the Company’s financial statements and related MD&A for the year ended July 31, 2023, and the interim financial reports and related MD&A for the period ended October 31, 2023 and January 31, 2024, filed with the securities’ regulatory authorities in certain provinces of Canada and available at www.sedar.com.
Should one or more of these risks or uncertainties materialize, or should assumptions underlying the forward-looking information prove incorrect, actual results may vary materially from those described herein as intended, planned, anticipated, believed, estimated or expected. Although the Company has attempted to identify important risks, uncertainties and factors which could cause actual results to differ materially, there may be others that cause results not to be as anticipated, estimated or intended. The Company does not intend, and does not assume any obligation, to update this forward-looking information except as otherwise required by applicable law.
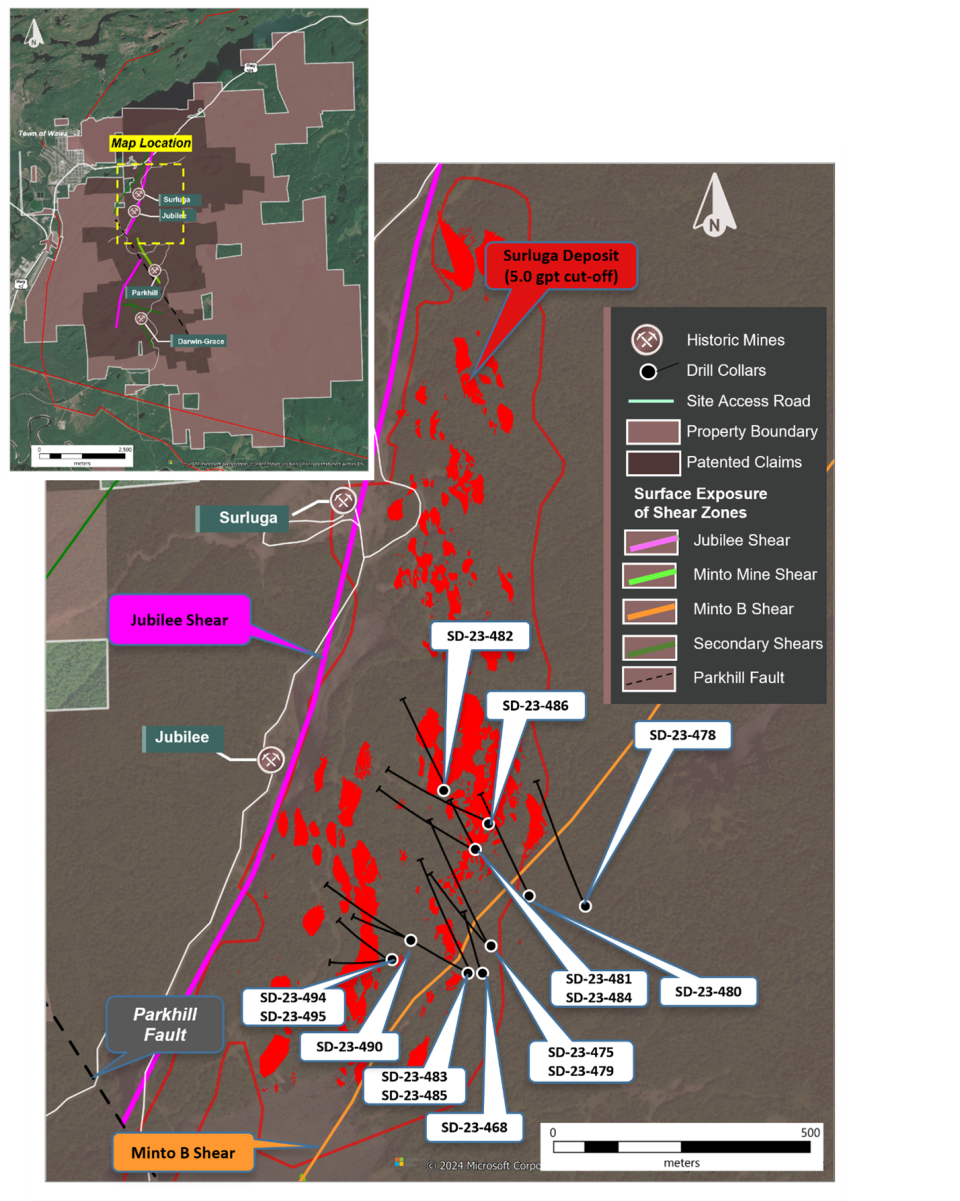
Figure 1 – Location of Diamond Drilling Results
https://www.globenewswire.com/NewsRoom/AttachmentNg/a544e552-0016-4eaa-9e71-45ef81b1f1fc
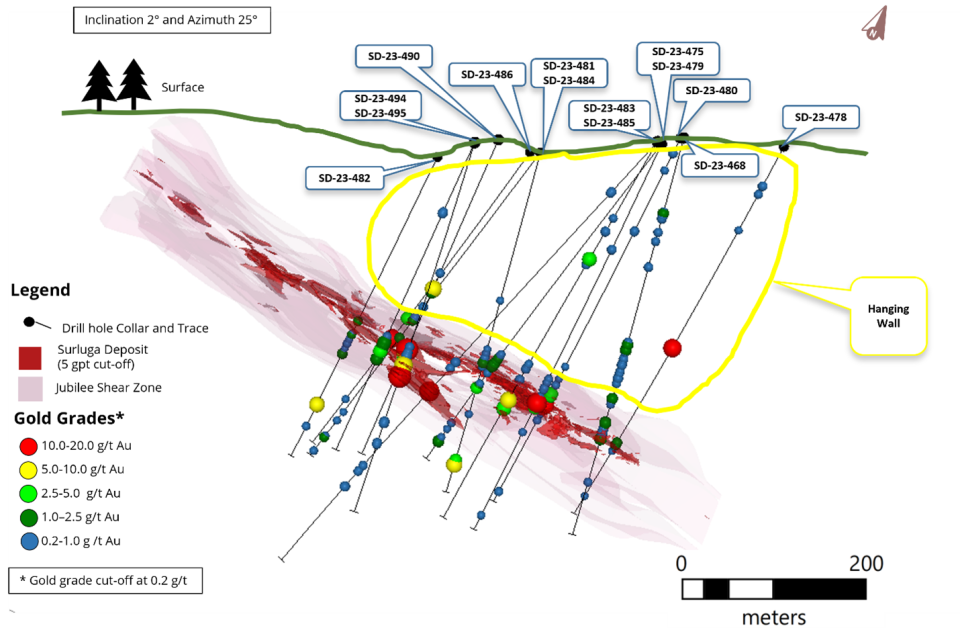
Figure 2 – 3D View of Diamond Drilling Results
https://www.globenewswire.com/NewsRoom/AttachmentNg/06db3212-8377-447d-95d8-d5982dfe2f5c

