
 Yahoo Finance
 There Are Reasons To Feel Uneasy About FIGS' (NYSE:FIGS) Returns On Capital
There are a few key trends to look for if we want to identify the next multi-bagger. In a perfect world, we'd like to see a company investing more capital into its business and ideally the returns earned from that capital are also increasing. Basically this means that a company has profitable initiatives that it can continue to reinvest in, which is a trait of a compounding machine. However, after investigating FIGS (NYSE:FIGS), we don't think it's current trends fit the mold of a multi-bagger.
Return On Capital Employed (ROCE): What Is It?
If you haven't worked with ROCE before, it measures the 'return' (pre-tax profit) a company generates from capital employed in its business. To calculate this metric for FIGS, this is the formula:
Return on Capital Employed = Earnings Before Interest and Tax (EBIT) ÷ (Total Assets - Current Liabilities)
0.071 = US$31m ÷ (US$511m - US$72m) (Based on the trailing twelve months to March 2024).
Therefore, FIGS has an ROCE of 7.1%. In absolute terms, that's a low return and it also under-performs the Luxury industry average of 12%.
Check out our latest analysis for FIGS
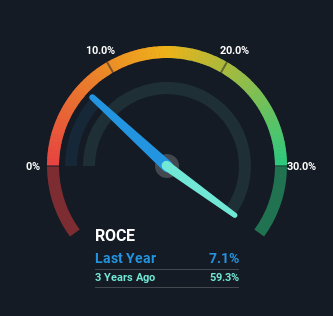
Above you can see how the current ROCE for FIGS compares to its prior returns on capital, but there's only so much you can tell from the past. If you'd like, you can check out the forecasts from the analysts covering FIGS for free.
How Are Returns Trending?
When we looked at the ROCE trend at FIGS, we didn't gain much confidence. Over the last four years, returns on capital have decreased to 7.1% from 25% four years ago. However it looks like FIGS might be reinvesting for long term growth because while capital employed has increased, the company's sales haven't changed much in the last 12 months. It's worth keeping an eye on the company's earnings from here on to see if these investments do end up contributing to the bottom line.
On a related note, FIGS has decreased its current liabilities to 14% of total assets. So we could link some of this to the decrease in ROCE. What's more, this can reduce some aspects of risk to the business because now the company's suppliers or short-term creditors are funding less of its operations. Some would claim this reduces the business' efficiency at generating ROCE since it is now funding more of the operations with its own money.
Our Take On FIGS' ROCE
To conclude, we've found that FIGS is reinvesting in the business, but returns have been falling. Moreover, since the stock has crumbled 83% over the last three years, it appears investors are expecting the worst. On the whole, we aren't too inspired by the underlying trends and we think there may be better chances of finding a multi-bagger elsewhere.
If you're still interested in FIGS it's worth checking out our FREE intrinsic value approximation for FIGS to see if it's trading at an attractive price in other respects.
While FIGS isn't earning the highest return, check out this free list of companies that are earning high returns on equity with solid balance sheets.
Have feedback on this article? Concerned about the content? Get in touch with us directly. Alternatively, email editorial-team (at) simplywallst.com.
This article by Simply Wall St is general in nature. We provide commentary based on historical data and analyst forecasts only using an unbiased methodology and our articles are not intended to be financial advice. It does not constitute a recommendation to buy or sell any stock, and does not take account of your objectives, or your financial situation. We aim to bring you long-term focused analysis driven by fundamental data. Note that our analysis may not factor in the latest price-sensitive company announcements or qualitative material. Simply Wall St has no position in any stocks mentioned.
