
 Yahoo Finance
 There Are Reasons To Feel Uneasy About Clearfield's (NASDAQ:CLFD) Returns On Capital
To find a multi-bagger stock, what are the underlying trends we should look for in a business? Firstly, we'd want to identify a growing return on capital employed (ROCE) and then alongside that, an ever-increasing base of capital employed. Basically this means that a company has profitable initiatives that it can continue to reinvest in, which is a trait of a compounding machine. However, after briefly looking over the numbers, we don't think Clearfield (NASDAQ:CLFD) has the makings of a multi-bagger going forward, but let's have a look at why that may be.
Understanding Return On Capital Employed (ROCE)
For those who don't know, ROCE is a measure of a company's yearly pre-tax profit (its return), relative to the capital employed in the business. To calculate this metric for Clearfield, this is the formula:
Return on Capital Employed = Earnings Before Interest and Tax (EBIT) ÷ (Total Assets - Current Liabilities)
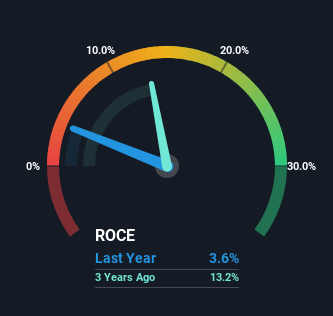
0.036 = US$11m ÷ (US$336m - US$25m) (Based on the trailing twelve months to December 2023).
Thus, Clearfield has an ROCE of 3.6%. Ultimately, that's a low return and it under-performs the Communications industry average of 8.3%.
View our latest analysis for Clearfield
Above you can see how the current ROCE for Clearfield compares to its prior returns on capital, but there's only so much you can tell from the past. If you'd like to see what analysts are forecasting going forward, you should check out our free analyst report for Clearfield .
So How Is Clearfield's ROCE Trending?
In terms of Clearfield's historical ROCE movements, the trend isn't fantastic. To be more specific, ROCE has fallen from 9.2% over the last five years. And considering revenue has dropped while employing more capital, we'd be cautious. If this were to continue, you might be looking at a company that is trying to reinvest for growth but is actually losing market share since sales haven't increased.
The Key Takeaway
In summary, we're somewhat concerned by Clearfield's diminishing returns on increasing amounts of capital. Yet despite these concerning fundamentals, the stock has performed strongly with a 93% return over the last five years, so investors appear very optimistic. Regardless, we don't feel too comfortable with the fundamentals so we'd be steering clear of this stock for now.
Clearfield does come with some risks though, we found 2 warning signs in our investment analysis, and 1 of those makes us a bit uncomfortable...
While Clearfield isn't earning the highest return, check out this free list of companies that are earning high returns on equity with solid balance sheets.
Have feedback on this article? Concerned about the content? Get in touch with us directly. Alternatively, email editorial-team (at) simplywallst.com.
This article by Simply Wall St is general in nature. We provide commentary based on historical data and analyst forecasts only using an unbiased methodology and our articles are not intended to be financial advice. It does not constitute a recommendation to buy or sell any stock, and does not take account of your objectives, or your financial situation. We aim to bring you long-term focused analysis driven by fundamental data. Note that our analysis may not factor in the latest price-sensitive company announcements or qualitative material. Simply Wall St has no position in any stocks mentioned.
