
 Yahoo Finance
 There Are Reasons To Feel Uneasy About Andrew Peller's (TSE:ADW.A) Returns On Capital
Finding a business that has the potential to grow substantially is not easy, but it is possible if we look at a few key financial metrics. One common approach is to try and find a company with returns on capital employed (ROCE) that are increasing, in conjunction with a growing amount of capital employed. If you see this, it typically means it's a company with a great business model and plenty of profitable reinvestment opportunities. However, after investigating Andrew Peller (TSE:ADW.A), we don't think it's current trends fit the mold of a multi-bagger.
Return On Capital Employed (ROCE): What Is It?
For those who don't know, ROCE is a measure of a company's yearly pre-tax profit (its return), relative to the capital employed in the business. The formula for this calculation on Andrew Peller is:
Return on Capital Employed = Earnings Before Interest and Tax (EBIT) ÷ (Total Assets - Current Liabilities)
0.034 = CA$17m ÷ (CA$545m - CA$45m) (Based on the trailing twelve months to December 2023).
Thus, Andrew Peller has an ROCE of 3.4%. Ultimately, that's a low return and it under-performs the Beverage industry average of 15%.
View our latest analysis for Andrew Peller
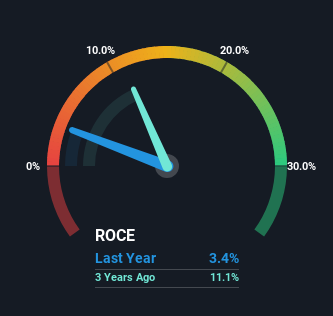
In the above chart we have measured Andrew Peller's prior ROCE against its prior performance, but the future is arguably more important. If you'd like to see what analysts are forecasting going forward, you should check out our free analyst report for Andrew Peller .
So How Is Andrew Peller's ROCE Trending?
In terms of Andrew Peller's historical ROCE movements, the trend isn't fantastic. To be more specific, ROCE has fallen from 12% over the last five years. On the other hand, the company has been employing more capital without a corresponding improvement in sales in the last year, which could suggest these investments are longer term plays. It's worth keeping an eye on the company's earnings from here on to see if these investments do end up contributing to the bottom line.
On a related note, Andrew Peller has decreased its current liabilities to 8.3% of total assets. That could partly explain why the ROCE has dropped. What's more, this can reduce some aspects of risk to the business because now the company's suppliers or short-term creditors are funding less of its operations. Since the business is basically funding more of its operations with it's own money, you could argue this has made the business less efficient at generating ROCE.
The Bottom Line
In summary, Andrew Peller is reinvesting funds back into the business for growth but unfortunately it looks like sales haven't increased much just yet. And investors appear hesitant that the trends will pick up because the stock has fallen 65% in the last five years. Therefore based on the analysis done in this article, we don't think Andrew Peller has the makings of a multi-bagger.
Andrew Peller does have some risks, we noticed 3 warning signs (and 2 which don't sit too well with us) we think you should know about.
While Andrew Peller isn't earning the highest return, check out this free list of companies that are earning high returns on equity with solid balance sheets.
Have feedback on this article? Concerned about the content? Get in touch with us directly. Alternatively, email editorial-team (at) simplywallst.com.
This article by Simply Wall St is general in nature. We provide commentary based on historical data and analyst forecasts only using an unbiased methodology and our articles are not intended to be financial advice. It does not constitute a recommendation to buy or sell any stock, and does not take account of your objectives, or your financial situation. We aim to bring you long-term focused analysis driven by fundamental data. Note that our analysis may not factor in the latest price-sensitive company announcements or qualitative material. Simply Wall St has no position in any stocks mentioned.
