
 Yahoo Finance
 Real Brokerage (CVE:REAX) investors are sitting on a loss of 43% if they invested a year ago
The simplest way to benefit from a rising market is to buy an index fund. While individual stocks can be big winners, plenty more fail to generate satisfactory returns. For example, the The Real Brokerage Inc. (CVE:REAX) share price is down 43% in the last year. That's well below the market decline of 1.4%. Because Real Brokerage hasn't been listed for many years, the market is still learning about how the business performs. The share price has dropped 44% in three months.
With that in mind, it's worth seeing if the company's underlying fundamentals have been the driver of long term performance, or if there are some discrepancies.
View our latest analysis for Real Brokerage
Real Brokerage wasn't profitable in the last twelve months, it is unlikely we'll see a strong correlation between its share price and its earnings per share (EPS). Arguably revenue is our next best option. Generally speaking, companies without profits are expected to grow revenue every year, and at a good clip. That's because fast revenue growth can be easily extrapolated to forecast profits, often of considerable size.
In the last year Real Brokerage saw its revenue grow by 659%. That's well above most other pre-profit companies. Given the revenue growth, the share price drop of 43% seems quite harsh. Our sympathies to shareholders who are now underwater. Prima facie, revenue growth like that should be a good thing, so it's worth checking whether losses have stabilized. Our brains have evolved to think in linear fashion, so there's value in learning to recognize exponential growth. We are, in some ways, simply the wisest of the monkeys.
You can see below how earnings and revenue have changed over time (discover the exact values by clicking on the image).
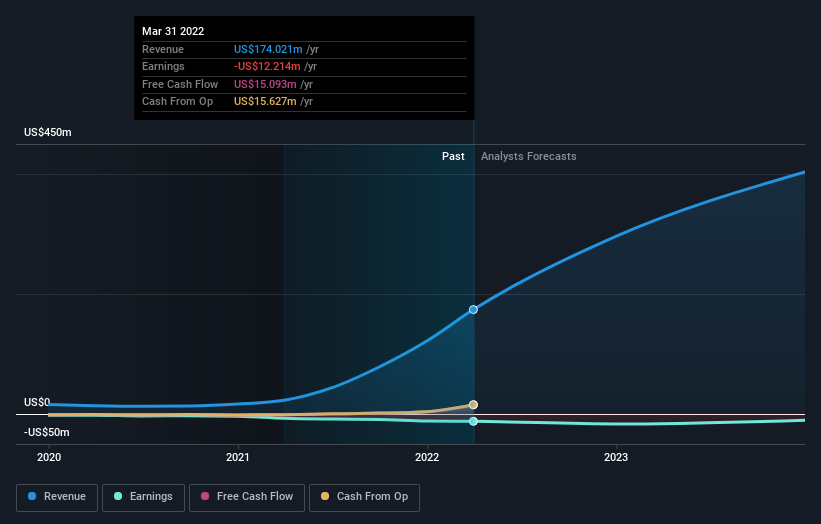
We consider it positive that insiders have made significant purchases in the last year. Having said that, most people consider earnings and revenue growth trends to be a more meaningful guide to the business. You can see what analysts are predicting for Real Brokerage in this interactive graph of future profit estimates.
A Different Perspective
We doubt Real Brokerage shareholders are happy with the loss of 43% over twelve months. That falls short of the market, which lost 1.4%. That's disappointing, but it's worth keeping in mind that the market-wide selling wouldn't have helped. It's worth noting that the last three months did the real damage, with a 44% decline. This probably signals that the business has recently disappointed shareholders - it will take time to win them back. It's always interesting to track share price performance over the longer term. But to understand Real Brokerage better, we need to consider many other factors. Consider for instance, the ever-present spectre of investment risk. We've identified 4 warning signs with Real Brokerage , and understanding them should be part of your investment process.
If you like to buy stocks alongside management, then you might just love this free list of companies. (Hint: insiders have been buying them).
Please note, the market returns quoted in this article reflect the market weighted average returns of stocks that currently trade on CA exchanges.
Have feedback on this article? Concerned about the content? Get in touch with us directly. Alternatively, email editorial-team (at) simplywallst.com.
This article by Simply Wall St is general in nature. We provide commentary based on historical data and analyst forecasts only using an unbiased methodology and our articles are not intended to be financial advice. It does not constitute a recommendation to buy or sell any stock, and does not take account of your objectives, or your financial situation. We aim to bring you long-term focused analysis driven by fundamental data. Note that our analysis may not factor in the latest price-sensitive company announcements or qualitative material. Simply Wall St has no position in any stocks mentioned.
