
 Yahoo Finance
 Read This Before You Buy Old Point Financial Corporation (NASDAQ:OPOF) Because Of Its P/E Ratio

To the annoyance of some shareholders, Old Point Financial (NASDAQ:OPOF) shares are down a considerable in the last month. Zooming out, the recent drop wiped out a year's worth of gains, with the share price now back where it was a year ago.
All else being equal, a sharp share price increase should make a stock less attractive to potential investors. While the market sentiment towards a stock is very changeable, in the long run, the share price will tend to move in the same direction as earnings per share. So some would prefer to hold off buying when there is a lot of optimism towards a stock. Perhaps the simplest way to get a read on investors' expectations of a business is to look at its Price to Earnings Ratio (PE Ratio). A high P/E implies that investors have high expectations of what a company can achieve compared to a company with a low P/E ratio.
Check out our latest analysis for Old Point Financial
Does Old Point Financial Have A Relatively High Or Low P/E For Its Industry?
Old Point Financial's P/E of 14.91 indicates some degree of optimism towards the stock. You can see in the image below that the average P/E (10.5) for companies in the banks industry is lower than Old Point Financial's P/E.
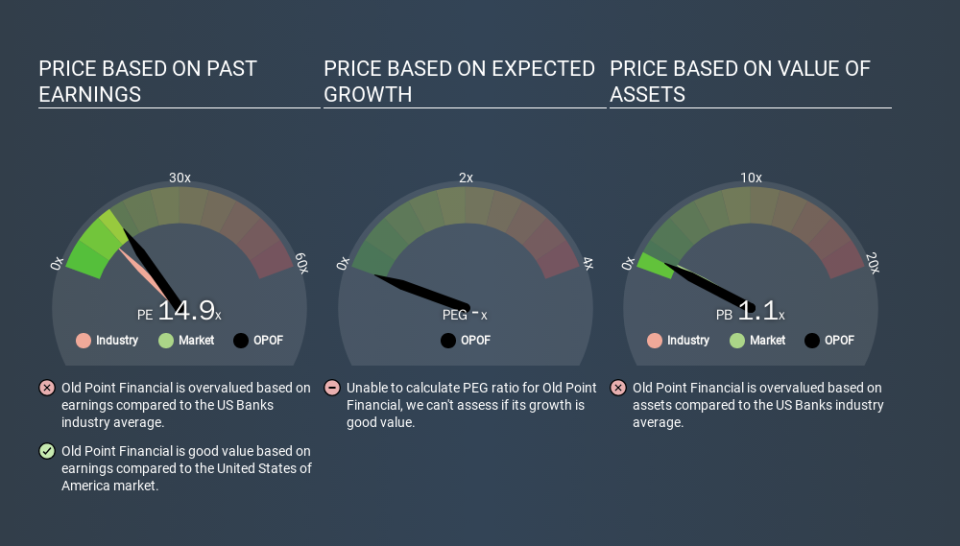
Its relatively high P/E ratio indicates that Old Point Financial shareholders think it will perform better than other companies in its industry classification. The market is optimistic about the future, but that doesn't guarantee future growth. So investors should delve deeper. I like to check if company insiders have been buying or selling.
How Growth Rates Impact P/E Ratios
Generally speaking the rate of earnings growth has a profound impact on a company's P/E multiple. That's because companies that grow earnings per share quickly will rapidly increase the 'E' in the equation. And in that case, the P/E ratio itself will drop rather quickly. A lower P/E should indicate the stock is cheap relative to others -- and that may attract buyers.
In the last year, Old Point Financial grew EPS like Taylor Swift grew her fan base back in 2010; the 58% gain was both fast and well deserved. And earnings per share have improved by 25% annually, over the last three years. So you might say it really deserves to have an above-average P/E ratio.
A Limitation: P/E Ratios Ignore Debt and Cash In The Bank
Don't forget that the P/E ratio considers market capitalization. Thus, the metric does not reflect cash or debt held by the company. In theory, a company can lower its future P/E ratio by using cash or debt to invest in growth.
Spending on growth might be good or bad a few years later, but the point is that the P/E ratio does not account for the option (or lack thereof).
Old Point Financial's Balance Sheet
Old Point Financial has net cash of US$40m. This is fairly high at 34% of its market capitalization. That might mean balance sheet strength is important to the business, but should also help push the P/E a bit higher than it would otherwise be.
The Verdict On Old Point Financial's P/E Ratio
Old Point Financial trades on a P/E ratio of 14.9, which is fairly close to the US market average of 15.3. Its net cash position is the cherry on top of its superb EPS growth. So at a glance we're a bit surprised that Old Point Financial does not have a higher P/E ratio. What can be absolutely certain is that the market has become less optimistic about Old Point Financial over the last month, with the P/E ratio falling from 14.9 back then to 14.9 today. For those who prefer to invest with the flow of momentum, that might be a bad sign, but for a contrarian, it may signal opportunity.
When the market is wrong about a stock, it gives savvy investors an opportunity. If it is underestimating a company, investors can make money by buying and holding the shares until the market corrects itself. Although we don't have analyst forecasts shareholders might want to examine this detailed historical graph of earnings, revenue and cash flow.
You might be able to find a better buy than Old Point Financial. If you want a selection of possible winners, check out this free list of interesting companies that trade on a P/E below 20 (but have proven they can grow earnings).
If you spot an error that warrants correction, please contact the editor at editorial-team@simplywallst.com. This article by Simply Wall St is general in nature. It does not constitute a recommendation to buy or sell any stock, and does not take account of your objectives, or your financial situation. Simply Wall St has no position in the stocks mentioned.
We aim to bring you long-term focused research analysis driven by fundamental data. Note that our analysis may not factor in the latest price-sensitive company announcements or qualitative material. Thank you for reading.
