
 Yahoo Finance
 Read This Before You Buy Norwegian Cruise Line Holdings Ltd. (NYSE:NCLH) Because Of Its P/E Ratio

Want to participate in a short research study? Help shape the future of investing tools and you could win a $250 gift card!
This article is written for those who want to get better at using price to earnings ratios (P/E ratios). We'll show how you can use Norwegian Cruise Line Holdings Ltd.'s (NYSE:NCLH) P/E ratio to inform your assessment of the investment opportunity. Norwegian Cruise Line Holdings has a price to earnings ratio of 12.54, based on the last twelve months. That is equivalent to an earnings yield of about 8.0%.
See our latest analysis for Norwegian Cruise Line Holdings
How Do You Calculate Norwegian Cruise Line Holdings's P/E Ratio?
The formula for P/E is:
Price to Earnings Ratio = Price per Share ÷ Earnings per Share (EPS)
Or for Norwegian Cruise Line Holdings:
P/E of 12.54 = $55.16 ÷ $4.4 (Based on the year to March 2019.)
Is A High P/E Ratio Good?
The higher the P/E ratio, the higher the price tag of a business, relative to its trailing earnings. That isn't necessarily good or bad, but a high P/E implies relatively high expectations of what a company can achieve in the future.
How Growth Rates Impact P/E Ratios
Probably the most important factor in determining what P/E a company trades on is the earnings growth. That's because companies that grow earnings per share quickly will rapidly increase the 'E' in the equation. That means even if the current P/E is high, it will reduce over time if the share price stays flat. So while a stock may look expensive based on past earnings, it could be cheap based on future earnings.
Notably, Norwegian Cruise Line Holdings grew EPS by a whopping 25% in the last year. And it has bolstered its earnings per share by 29% per year over the last five years. I'd therefore be a little surprised if its P/E ratio was not relatively high.
Does Norwegian Cruise Line Holdings Have A Relatively High Or Low P/E For Its Industry?
The P/E ratio indicates whether the market has higher or lower expectations of a company. If you look at the image below, you can see Norwegian Cruise Line Holdings has a lower P/E than the average (22.9) in the hospitality industry classification.
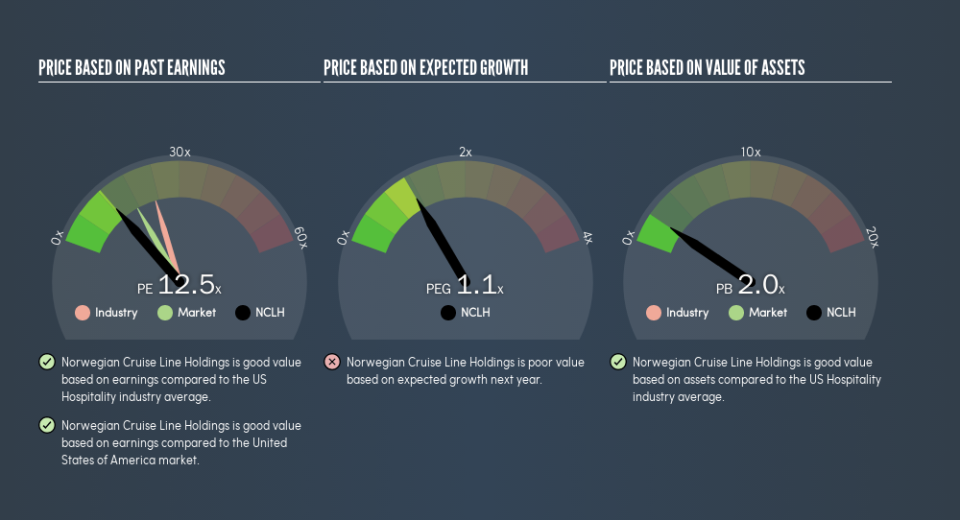
Its relatively low P/E ratio indicates that Norwegian Cruise Line Holdings shareholders think it will struggle to do as well as other companies in its industry classification. While current expectations are low, the stock could be undervalued if the situation is better than the market assumes. You should delve deeper. I like to check if company insiders have been buying or selling.
Remember: P/E Ratios Don't Consider The Balance Sheet
One drawback of using a P/E ratio is that it considers market capitalization, but not the balance sheet. So it won't reflect the advantage of cash, or disadvantage of debt. Theoretically, a business can improve its earnings (and produce a lower P/E in the future) by investing in growth. That means taking on debt (or spending its cash).
Such spending might be good or bad, overall, but the key point here is that you need to look at debt to understand the P/E ratio in context.
Norwegian Cruise Line Holdings's Balance Sheet
Net debt totals 55% of Norwegian Cruise Line Holdings's market cap. This is enough debt that you'd have to make some adjustments before using the P/E ratio to compare it to a company with net cash.
The Verdict On Norwegian Cruise Line Holdings's P/E Ratio
Norwegian Cruise Line Holdings trades on a P/E ratio of 12.5, which is below the US market average of 17.2. While the EPS growth last year was strong, the significant debt levels reduce the number of options available to management. The low P/E ratio suggests current market expectations are muted, implying these levels of growth will not continue.
Investors should be looking to buy stocks that the market is wrong about. If the reality for a company is not as bad as the P/E ratio indicates, then the share price should increase as the market realizes this. So this free visualization of the analyst consensus on future earnings could help you make the right decision about whether to buy, sell, or hold.
But note: Norwegian Cruise Line Holdings may not be the best stock to buy. So take a peek at this free list of interesting companies with strong recent earnings growth (and a P/E ratio below 20).
We aim to bring you long-term focused research analysis driven by fundamental data. Note that our analysis may not factor in the latest price-sensitive company announcements or qualitative material.
If you spot an error that warrants correction, please contact the editor at editorial-team@simplywallst.com. This article by Simply Wall St is general in nature. It does not constitute a recommendation to buy or sell any stock, and does not take account of your objectives, or your financial situation. Simply Wall St has no position in the stocks mentioned. Thank you for reading.