
 Yahoo Finance
 Read This Before You Buy Martinrea International Inc (TSE:MRE) Because Of Its P/E Ratio

This article is for investors who would like to improve their understanding of price to earnings ratios (P/E ratios). We’ll show how you can use Martinrea International Inc’s (TSE:MRE) P/E ratio to inform your assessment of the investment opportunity. Martinrea International has a price to earnings ratio of 5.67, based on the last twelve months. That corresponds to an earnings yield of approximately 18%.
Check out our latest analysis for Martinrea International
How Do You Calculate A P/E Ratio?
The formula for P/E is:
Price to Earnings Ratio = Share Price ÷ Earnings per Share (EPS)
Or for Martinrea International:
P/E of 5.67 = CA$11.8 ÷ CA$2.08 (Based on the year to September 2018.)
Is A High P/E Ratio Good?
A higher P/E ratio means that investors are paying a higher price for each CA$1 of company earnings. That isn’t necessarily good or bad, but a high P/E implies relatively high expectations of what a company can achieve in the future.
How Growth Rates Impact P/E Ratios
Probably the most important factor in determining what P/E a company trades on is the earnings growth. When earnings grow, the ‘E’ increases, over time. That means unless the share price increases, the P/E will reduce in a few years. Then, a lower P/E should attract more buyers, pushing the share price up.
Martinrea International increased earnings per share by an impressive 14% over the last twelve months. And earnings per share have improved by 33% annually, over the last five years. This could arguably justify a relatively high P/E ratio.
How Does Martinrea International’s P/E Ratio Compare To Its Peers?
The P/E ratio indicates whether the market has higher or lower expectations of a company. We can see in the image below that the average P/E (12.4) for companies in the auto components industry is higher than Martinrea International’s P/E.
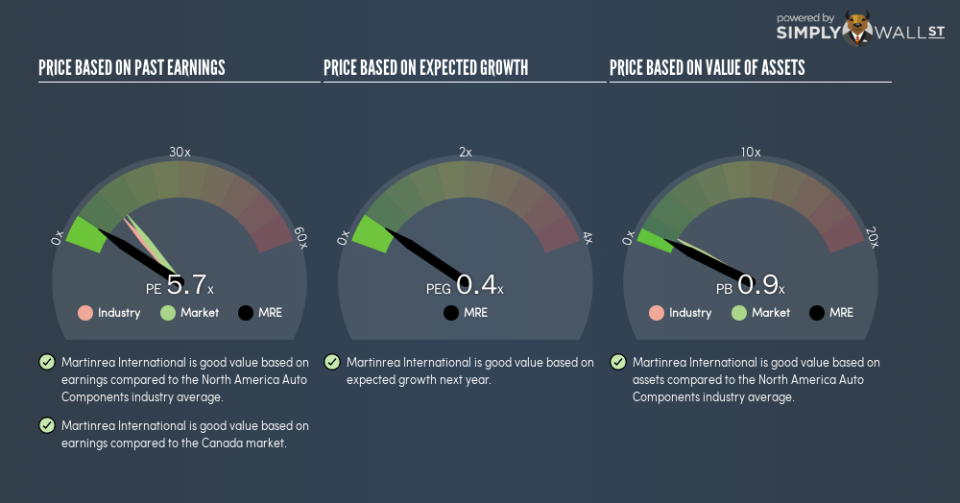
This suggests that market participants think Martinrea International will underperform other companies in its industry. Since the market seems unimpressed with Martinrea International, it’s quite possible it could surprise on the upside. It is arguably worth checking if insiders are buying shares, because that might imply they believe the stock is undervalued.
A Limitation: P/E Ratios Ignore Debt and Cash In The Bank
The ‘Price’ in P/E reflects the market capitalization of the company. Thus, the metric does not reflect cash or debt held by the company. Hypothetically, a company could reduce its future P/E ratio by spending its cash (or taking on debt) to achieve higher earnings.
Such expenditure might be good or bad, in the long term, but the point here is that the balance sheet is not reflected by this ratio.
Martinrea International’s Balance Sheet
Net debt totals 61% of Martinrea International’s market cap. This is enough debt that you’d have to make some adjustments before using the P/E ratio to compare it to a company with net cash.
The Bottom Line On Martinrea International’s P/E Ratio
Martinrea International has a P/E of 5.7. That’s below the average in the CA market, which is 13.8. The company may have significant debt, but EPS growth was good last year. If the company can continue to grow earnings, then the current P/E may be unjustifiably low.
Investors have an opportunity when market expectations about a stock are wrong. As value investor Benjamin Graham famously said, ‘In the short run, the market is a voting machine but in the long run, it is a weighing machine.’ So this free visualization of the analyst consensus on future earnings could help you make the right decision about whether to buy, sell, or hold.
But note: Martinrea International may not be the best stock to buy. So take a peek at this free list of interesting companies with strong recent earnings growth (and a P/E ratio below 20).
To help readers see past the short term volatility of the financial market, we aim to bring you a long-term focused research analysis purely driven by fundamental data. Note that our analysis does not factor in the latest price-sensitive company announcements.
The author is an independent contributor and at the time of publication had no position in the stocks mentioned. For errors that warrant correction please contact the editor at editorial-team@simplywallst.com.
