
 Yahoo Finance
 Read This Before You Buy Daqo New Energy Corp. (NYSE:DQ) Because Of Its P/E Ratio

This article is for investors who would like to improve their understanding of price to earnings ratios (P/E ratios). To keep it practical, we'll show how Daqo New Energy Corp.'s (NYSE:DQ) P/E ratio could help you assess the value on offer. What is Daqo New Energy's P/E ratio? Well, based on the last twelve months it is 14.94. That corresponds to an earnings yield of approximately 6.7%.
See our latest analysis for Daqo New Energy
How Do I Calculate A Price To Earnings Ratio?
The formula for P/E is:
Price to Earnings Ratio = Share Price ÷ Earnings per Share (EPS)
Or for Daqo New Energy:
P/E of 14.94 = $43.1 ÷ $2.88 (Based on the trailing twelve months to March 2019.)
Is A High Price-to-Earnings Ratio Good?
The higher the P/E ratio, the higher the price tag of a business, relative to its trailing earnings. All else being equal, it's better to pay a low price -- but as Warren Buffett said, 'It's far better to buy a wonderful company at a fair price than a fair company at a wonderful price.'
How Does Daqo New Energy's P/E Ratio Compare To Its Peers?
We can get an indication of market expectations by looking at the P/E ratio. We can see in the image below that the average P/E (23.1) for companies in the semiconductor industry is higher than Daqo New Energy's P/E.
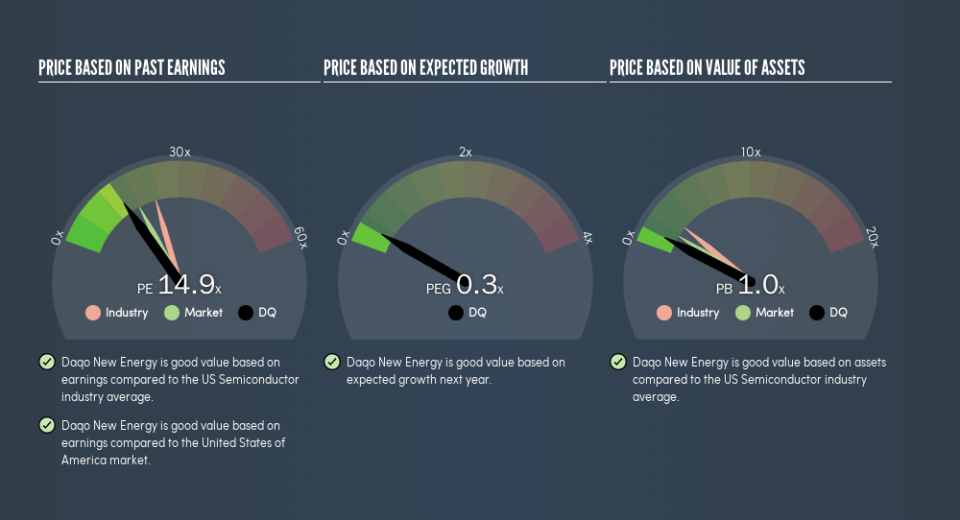
This suggests that market participants think Daqo New Energy will underperform other companies in its industry. Many investors like to buy stocks when the market is pessimistic about their prospects. It is arguably worth checking if insiders are buying shares, because that might imply they believe the stock is undervalued.
How Growth Rates Impact P/E Ratios
Earnings growth rates have a big influence on P/E ratios. If earnings are growing quickly, then the 'E' in the equation will increase faster than it would otherwise. That means unless the share price increases, the P/E will reduce in a few years. Then, a lower P/E should attract more buyers, pushing the share price up.
Daqo New Energy's earnings per share fell by 70% in the last twelve months. But it has grown its earnings per share by 15% per year over the last three years.
A Limitation: P/E Ratios Ignore Debt and Cash In The Bank
One drawback of using a P/E ratio is that it considers market capitalization, but not the balance sheet. That means it doesn't take debt or cash into account. In theory, a company can lower its future P/E ratio by using cash or debt to invest in growth.
Such expenditure might be good or bad, in the long term, but the point here is that the balance sheet is not reflected by this ratio.
How Does Daqo New Energy's Debt Impact Its P/E Ratio?
Daqo New Energy has net debt worth 22% of its market capitalization. It would probably deserve a higher P/E ratio if it was net cash, since it would have more options for growth.
The Bottom Line On Daqo New Energy's P/E Ratio
Daqo New Energy trades on a P/E ratio of 14.9, which is below the US market average of 18. Since it only carries a modest debt load, it's likely the low expectations implied by the P/E ratio arise from the lack of recent earnings growth.
Investors have an opportunity when market expectations about a stock are wrong. If the reality for a company is not as bad as the P/E ratio indicates, then the share price should increase as the market realizes this. So this free report on the analyst consensus forecasts could help you make a master move on this stock.
Of course, you might find a fantastic investment by looking at a few good candidates. So take a peek at this free list of companies with modest (or no) debt, trading on a P/E below 20.
We aim to bring you long-term focused research analysis driven by fundamental data. Note that our analysis may not factor in the latest price-sensitive company announcements or qualitative material.
If you spot an error that warrants correction, please contact the editor at editorial-team@simplywallst.com. This article by Simply Wall St is general in nature. It does not constitute a recommendation to buy or sell any stock, and does not take account of your objectives, or your financial situation. Simply Wall St has no position in the stocks mentioned. Thank you for reading.
