
 Yahoo Finance
 Ralph Lauren (RL) Q4 Earnings Beat Estimates, Revenues Up Y/Y
Ralph Lauren Corporation RL has posted impressive fourth-quarter fiscal 2024 results, wherein the top and bottom lines beat the Zacks Consensus Estimate. Results have gained from robust demand and brand strength. The company has been on track with its Next Great Chapter: Accelerate plan.
RL has reported adjusted earnings per share of $1.71, which surpassed the Zacks Consensus Estimate of $1.65. Also, the bottom line increased from earnings of 90 cents per share reported in the year-earlier quarter.
Net revenues grew 2% year over year to $1,567.9 million and beat the Zacks Consensus Estimate of $1,553 million. On a constant-currency (cc) basis, revenues were up 3% from the year-ago quarter. The top line witnessed growth across all regions, driven by brand strength, pricing efforts and continued strategic investments. Global direct-to-consumer comparable store sales jumped 6%, backed by continued brand elevation, double-digit increases in average unit retail ("AUR") and full-price retail performance. However, the top line witnessed the negative impacts of 110 basis points (bps) from foreign currency rates.
Ralph Lauren Corporation Price, Consensus and EPS Surprise
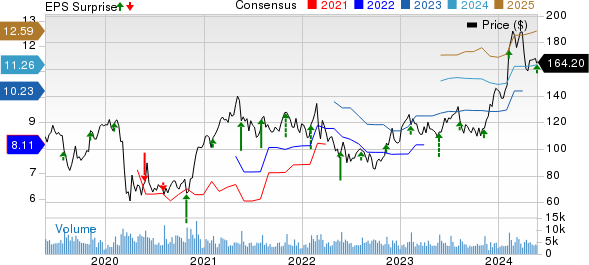
Ralph Lauren Corporation price-consensus-eps-surprise-chart | Ralph Lauren Corporation Quote
Shares of this Zacks Rank #3 (Hold) company have gained 33.1% in the past six months against the industry’s 10.6% drop.
Segmental Details
North America: The segment’s revenues were up 2% year over year to $668 million and came ahead of our estimate of $632.7 million. Comparable store sales (comps) for North America’s retail channel rose 3% year over year wherein the same for brick-and-mortar stores moved up 6%, while digital commerce fell 4%. Revenues from the North America wholesale business dipped 2% year over year.
Europe: The segment’s revenues rose 2% year over year to $469 million while the metric was up slightly on a currency-neutral basis. The metric beat our estimate of $456.2 million. Comps for the retail channel in Europe were up 12% whereas brick-and-mortar stores grew 13% year over year and digital sales witnessed an 11% rise. Revenues for the segment’s wholesale business were down 6% on a reported basis and 8% on a cc basis.
Asia: The segment’s revenues edged up 1% year over year to $394 million on a reported basis and 7% on a currency-neutral basis. The metric missed our estimate of $429 million. Comps in Asia were up 6%, backed by 4% growth in brick-and-mortar stores and a 19% increase in the digital business.
Margins
Ralph Lauren's adjusted gross profit margin expanded 480 bps year over year to 66.6%. This was mainly driven by lower freight costs, positive channel and geographic mix shifts, and AUR growth in all regions. The growth more than offset pressures from raw material costs. Recent pressures from cotton inflation have started to abate starting due to moderating cotton costs.
Adjusted operating expenses rose 3% from the year-ago period to $907 million. Adjusted operating expenses, as a percentage of sales, expanded 80 bps to 57.8%.
The company’s adjusted operating income was $137 million, up from $74.9 million reported in the year-earlier quarter. The adjusted operating margin increased 380 bps year over year to 8.7%.
Financials
Ralph Lauren ended the quarter with cash and short-term investments of $1.8 billion, a total debt of $1.1 billion and total shareholders’ equity of $2.5 billion. Inventory fell 16% year over year to $902 million.
The company repurchased Class A shares for about $121 million in the fiscal fourth quarter and $398 million during the fiscal year. At the end of fiscal 2024, it had roughly $776 million available under its total share repurchase authorization.
Impressively, the company’s board declared a 10% hike in the regular quarterly cash dividend to 82.50 cents per share, payable Jul 12, 2024, to shareholders of record as of Jun 28, 2024.
The company had $165 million in capital expenditures in the fiscal year compared with $217 million in the last fiscal. Management expects a capital expenditure in the range of $300-$325 million for fiscal 2025.
Store Update
As of Mar 30, 2024, Ralph Lauren had 564 directly operated stores and 699 concession shops globally. The directly operated stores included 232 Ralph Lauren and 332 Outlet stores. The company operated 195 licensed stores globally as of the same date.
Outlook
For fiscal 2025, RL anticipates year-over-year revenue growth (at cc) in the low-single digits, revolving around 2-3%. This includes 90 bps of positive impacts of currency. Management expects the operating margin to grow in the range of 100-120 bps at cc on higher gross margin and operating expense leverage. The gross margin is likely to increase in the band of 50-100 bps in cc, with AUR growth, lower cotton costs, and favorable geographic and channel mix shift more than offsetting higher product costs. Foreign currency is anticipated to hurt gross and operating margins by about 30 bps. The fiscal tax rate is likely to be in the range of 23-24%.
For the fiscal first quarter, the company anticipates revenues to grow slightly on a cc basis. On a reported basis, including nearly 160 bps of negative foreign currency impacts, revenues are projected to be down slightly year over year. This includes approximately 50 bps of negative impacts of the earlier timing of Easter. Operating margin is likely to expand around 60-80 bps in cc on higher gross margins.
The gross margin is expected to grow in the range of 140-180 bps on lower cotton costs and AUR growth. Foreign currency is likely to hurt to the tune of 40 bps to both gross and operating margins.
Key Picks
Some better-ranked companies are G-III Apparel Group GIII, Royal Caribbean RCL and lululemon athletica LULU.
G-III Apparel Group sports a Zacks Rank #1 (Strong Buy), at present. You can see the complete list of today’s Zacks #1 Rank stocks here.
G-III Apparel Group has a trailing four-quarter earnings surprise of 547.9%, on average. The Zacks Consensus Estimate for GIII’s fiscal 2024 sales indicates an increase of 3.7% from the year-ago period’s reported level.
Royal Caribbean sports a Zacks Rank of 1, at present. RCL has a trailing four-quarter earnings surprise of 28.3%, on average.
The consensus estimate for RCL’s 2024 sales and earnings per share (EPS) indicates increases of 14.5% and 47.9%, respectively, from the year-ago period’s reported levels.
lululemon athletica is a yoga-inspired athletic apparel company. LULU carries a Zacks Rank # 2 (Buy), at present.
The Zacks Consensus Estimate for lululemon athletica’s current financial-year sales and EPS suggests growth of 13.7% and 15%, respectively, from the year-ago corresponding figures. LULU has a trailing four-quarter earnings surprise of 9.2%, on average.
Want the latest recommendations from Zacks Investment Research? Today, you can download 7 Best Stocks for the Next 30 Days. Click to get this free report
Royal Caribbean Cruises Ltd. (RCL) : Free Stock Analysis Report
Ralph Lauren Corporation (RL) : Free Stock Analysis Report
lululemon athletica inc. (LULU) : Free Stock Analysis Report
G-III Apparel Group, LTD. (GIII) : Free Stock Analysis Report
