
 Yahoo Finance
 Raffles Medical Group's (SGX:BSL) Returns Have Hit A Wall
To find a multi-bagger stock, what are the underlying trends we should look for in a business? Amongst other things, we'll want to see two things; firstly, a growing return on capital employed (ROCE) and secondly, an expansion in the company's amount of capital employed. Ultimately, this demonstrates that it's a business that is reinvesting profits at increasing rates of return. In light of that, when we looked at Raffles Medical Group (SGX:BSL) and its ROCE trend, we weren't exactly thrilled.
What Is Return On Capital Employed (ROCE)?
For those that aren't sure what ROCE is, it measures the amount of pre-tax profits a company can generate from the capital employed in its business. To calculate this metric for Raffles Medical Group, this is the formula:
Return on Capital Employed = Earnings Before Interest and Tax (EBIT) ÷ (Total Assets - Current Liabilities)
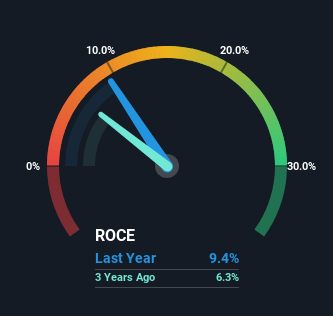
0.094 = S$108m ÷ (S$1.5b - S$379m) (Based on the trailing twelve months to December 2023).
Therefore, Raffles Medical Group has an ROCE of 9.4%. In absolute terms, that's a low return, but it's much better than the Healthcare industry average of 7.0%.
Check out our latest analysis for Raffles Medical Group
In the above chart we have measured Raffles Medical Group's prior ROCE against its prior performance, but the future is arguably more important. If you're interested, you can view the analysts predictions in our free analyst report for Raffles Medical Group .
What Can We Tell From Raffles Medical Group's ROCE Trend?
In terms of Raffles Medical Group's historical ROCE trend, it doesn't exactly demand attention. The company has employed 24% more capital in the last five years, and the returns on that capital have remained stable at 9.4%. Given the company has increased the amount of capital employed, it appears the investments that have been made simply don't provide a high return on capital.
Our Take On Raffles Medical Group's ROCE
In summary, Raffles Medical Group has simply been reinvesting capital and generating the same low rate of return as before. And with the stock having returned a mere 6.7% in the last five years to shareholders, you could argue that they're aware of these lackluster trends. Therefore, if you're looking for a multi-bagger, we'd propose looking at other options.
While Raffles Medical Group doesn't shine too bright in this respect, it's still worth seeing if the company is trading at attractive prices. You can find that out with our FREE intrinsic value estimation for BSL on our platform.
While Raffles Medical Group isn't earning the highest return, check out this free list of companies that are earning high returns on equity with solid balance sheets.
Have feedback on this article? Concerned about the content? Get in touch with us directly. Alternatively, email editorial-team (at) simplywallst.com.
This article by Simply Wall St is general in nature. We provide commentary based on historical data and analyst forecasts only using an unbiased methodology and our articles are not intended to be financial advice. It does not constitute a recommendation to buy or sell any stock, and does not take account of your objectives, or your financial situation. We aim to bring you long-term focused analysis driven by fundamental data. Note that our analysis may not factor in the latest price-sensitive company announcements or qualitative material. Simply Wall St has no position in any stocks mentioned.
