
 Yahoo Finance
 QYOU Media Inc. (CVE:QYOU) Not Lagging Industry On Growth Or Pricing
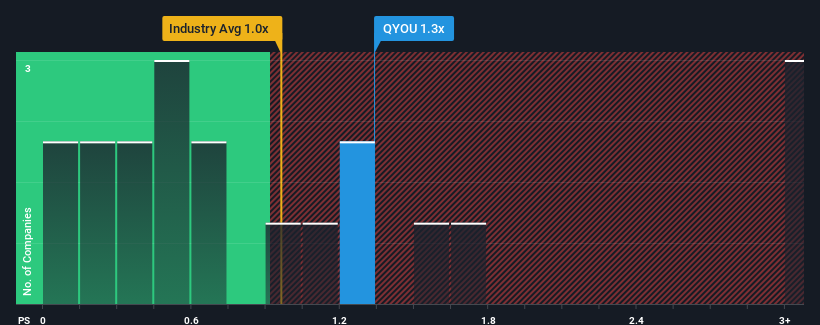
When you see that almost half of the companies in the Media industry in Canada have price-to-sales ratios (or "P/S") below 0.8x, QYOU Media Inc. (CVE:QYOU) looks to be giving off some sell signals with its 1.3x P/S ratio. However, the P/S might be high for a reason and it requires further investigation to determine if it's justified.
View our latest analysis for QYOU Media
What Does QYOU Media's P/S Mean For Shareholders?
Recent times have been quite advantageous for QYOU Media as its revenue has been rising very briskly. Perhaps the market is expecting future revenue performance to outperform the wider market, which has seemingly got people interested in the stock. If not, then existing shareholders might be a little nervous about the viability of the share price.
Although there are no analyst estimates available for QYOU Media, take a look at this free data-rich visualisation to see how the company stacks up on earnings, revenue and cash flow.
What Are Revenue Growth Metrics Telling Us About The High P/S?
In order to justify its P/S ratio, QYOU Media would need to produce impressive growth in excess of the industry.
Retrospectively, the last year delivered an exceptional 60% gain to the company's top line. This great performance means it was also able to deliver immense revenue growth over the last three years. So we can start by confirming that the company has done a tremendous job of growing revenue over that time.
Comparing that to the industry, which is only predicted to deliver 4.7% growth in the next 12 months, the company's momentum is stronger based on recent medium-term annualised revenue results.
With this in consideration, it's not hard to understand why QYOU Media's P/S is high relative to its industry peers. It seems most investors are expecting this strong growth to continue and are willing to pay more for the stock.
The Final Word
Generally, our preference is to limit the use of the price-to-sales ratio to establishing what the market thinks about the overall health of a company.
We've established that QYOU Media maintains its high P/S on the strength of its recent three-year growth being higher than the wider industry forecast, as expected. Right now shareholders are comfortable with the P/S as they are quite confident revenue aren't under threat. If recent medium-term revenue trends continue, it's hard to see the share price falling strongly in the near future under these circumstances.
And what about other risks? Every company has them, and we've spotted 4 warning signs for QYOU Media (of which 2 are concerning!) you should know about.
If strong companies turning a profit tickle your fancy, then you'll want to check out this free list of interesting companies that trade on a low P/E (but have proven they can grow earnings).
Have feedback on this article? Concerned about the content? Get in touch with us directly. Alternatively, email editorial-team (at) simplywallst.com.
This article by Simply Wall St is general in nature. We provide commentary based on historical data and analyst forecasts only using an unbiased methodology and our articles are not intended to be financial advice. It does not constitute a recommendation to buy or sell any stock, and does not take account of your objectives, or your financial situation. We aim to bring you long-term focused analysis driven by fundamental data. Note that our analysis may not factor in the latest price-sensitive company announcements or qualitative material. Simply Wall St has no position in any stocks mentioned.
