
 Yahoo Finance
 Quarto Group (LON:QRT) Is Investing Its Capital With Increasing Efficiency
What are the early trends we should look for to identify a stock that could multiply in value over the long term? Firstly, we'll want to see a proven return on capital employed (ROCE) that is increasing, and secondly, an expanding base of capital employed. Ultimately, this demonstrates that it's a business that is reinvesting profits at increasing rates of return. With that in mind, the ROCE of Quarto Group (LON:QRT) looks great, so lets see what the trend can tell us.
Understanding Return On Capital Employed (ROCE)
If you haven't worked with ROCE before, it measures the 'return' (pre-tax profit) a company generates from capital employed in its business. To calculate this metric for Quarto Group, this is the formula:
Return on Capital Employed = Earnings Before Interest and Tax (EBIT) ÷ (Total Assets - Current Liabilities)
0.21 = US$11m ÷ (US$153m - US$98m) (Based on the trailing twelve months to December 2020).
Therefore, Quarto Group has an ROCE of 21%. In absolute terms that's a great return and it's even better than the Media industry average of 6.9%.
See our latest analysis for Quarto Group
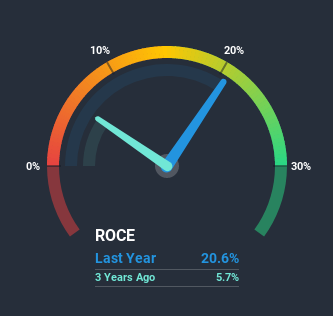
Historical performance is a great place to start when researching a stock so above you can see the gauge for Quarto Group's ROCE against it's prior returns. If you want to delve into the historical earnings, revenue and cash flow of Quarto Group, check out these free graphs here.
The Trend Of ROCE
Quarto Group has not disappointed in regards to ROCE growth. The data shows that returns on capital have increased by 84% over the trailing five years. That's not bad because this tells for every dollar invested (capital employed), the company is increasing the amount earned from that dollar. In regards to capital employed, Quarto Group appears to been achieving more with less, since the business is using 61% less capital to run its operation. If this trend continues, the business might be getting more efficient but it's shrinking in terms of total assets.
For the record though, there was a noticeable increase in the company's current liabilities over the period, so we would attribute some of the ROCE growth to that. The current liabilities has increased to 64% of total assets, so the business is now more funded by the likes of its suppliers or short-term creditors. And with current liabilities at those levels, that's pretty high.
The Bottom Line
In a nutshell, we're pleased to see that Quarto Group has been able to generate higher returns from less capital. Astute investors may have an opportunity here because the stock has declined 67% in the last five years. That being the case, research into the company's current valuation metrics and future prospects seems fitting.
If you'd like to know more about Quarto Group, we've spotted 5 warning signs, and 1 of them makes us a bit uncomfortable.
If you want to search for more stocks that have been earning high returns, check out this free list of stocks with solid balance sheets that are also earning high returns on equity.
This article by Simply Wall St is general in nature. It does not constitute a recommendation to buy or sell any stock, and does not take account of your objectives, or your financial situation. We aim to bring you long-term focused analysis driven by fundamental data. Note that our analysis may not factor in the latest price-sensitive company announcements or qualitative material. Simply Wall St has no position in any stocks mentioned.
Have feedback on this article? Concerned about the content? Get in touch with us directly. Alternatively, email editorial-team (at) simplywallst.com.
