
 Yahoo Finance
 Some Quanex Building Products (NYSE:NX) Shareholders Are Down 11%

Ideally, your overall portfolio should beat the market average. But the main game is to find enough winners to more than offset the losers So we wouldn't blame long term Quanex Building Products Corporation (NYSE:NX) shareholders for doubting their decision to hold, with the stock down 11% over a half decade. It's down 6.6% in the last seven days.
See our latest analysis for Quanex Building Products
While markets are a powerful pricing mechanism, share prices reflect investor sentiment, not just underlying business performance. By comparing earnings per share (EPS) and share price changes over time, we can get a feel for how investor attitudes to a company have morphed over time.
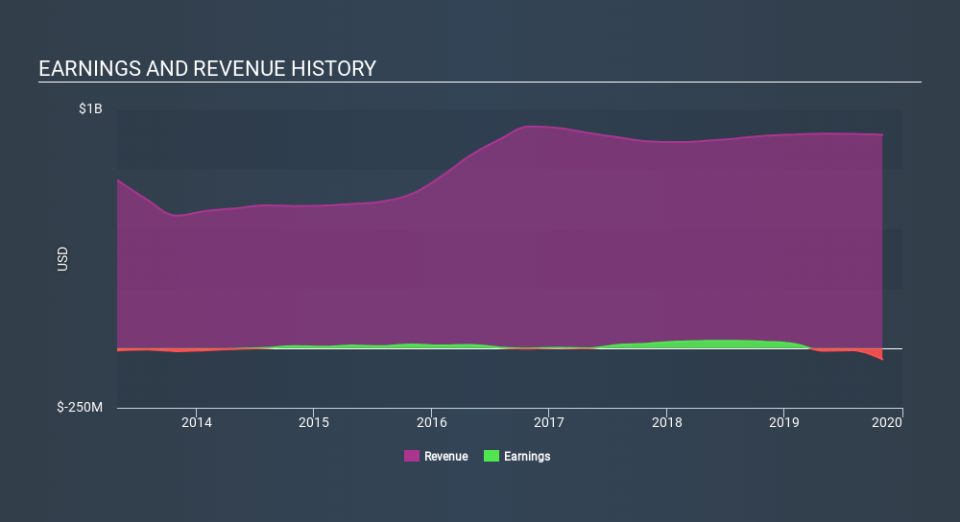
During five years of share price growth, Quanex Building Products moved from a loss to profitability. However, it made a loss in the last twelve months, suggesting profit may be an unreliable metric at this stage. Other metrics might give us a better handle on how its value is changing over time.
We don't think that the 1.8% is big factor in the share price, since it's quite small, as dividends go. Revenue is actually up 7.9% over the time period. So it seems one might have to take closer look at the fundamentals to understand why the share price languishes. After all, there may be an opportunity.
You can see how earnings and revenue have changed over time in the image below (click on the chart to see the exact values).
This free interactive report on Quanex Building Products's balance sheet strength is a great place to start, if you want to investigate the stock further.
What About Dividends?
It is important to consider the total shareholder return, as well as the share price return, for any given stock. The TSR is a return calculation that accounts for the value of cash dividends (assuming that any dividend received was reinvested) and the calculated value of any discounted capital raisings and spin-offs. So for companies that pay a generous dividend, the TSR is often a lot higher than the share price return. We note that for Quanex Building Products the TSR over the last 5 years was -5.4%, which is better than the share price return mentioned above. And there's no prize for guessing that the dividend payments largely explain the divergence!
A Different Perspective
Quanex Building Products shareholders are up 6.2% for the year (even including dividends) . But that was short of the market average. But at least that's still a gain! Over five years the TSR has been a reduction of 1.1% per year, over five years. It could well be that the business is stabilizing. While it is well worth considering the different impacts that market conditions can have on the share price, there are other factors that are even more important. For example, we've discovered 2 warning signs for Quanex Building Products (1 is a bit unpleasant!) that you should be aware of before investing here.
If you would prefer to check out another company -- one with potentially superior financials -- then do not miss this free list of companies that have proven they can grow earnings.
Please note, the market returns quoted in this article reflect the market weighted average returns of stocks that currently trade on US exchanges.
If you spot an error that warrants correction, please contact the editor at editorial-team@simplywallst.com. This article by Simply Wall St is general in nature. It does not constitute a recommendation to buy or sell any stock, and does not take account of your objectives, or your financial situation. Simply Wall St has no position in the stocks mentioned.
We aim to bring you long-term focused research analysis driven by fundamental data. Note that our analysis may not factor in the latest price-sensitive company announcements or qualitative material. Thank you for reading.
