
 Yahoo Finance
 Procter & Gamble Co's Dividend Analysis
Assessing the Sustainability and Growth of PG's Dividends
Procter & Gamble Co (NYSE:PG) recently announced a dividend of $1.01 per share, payable on 2024-05-15, with the ex-dividend date set for 2024-04-18. As investors look forward to this upcoming payment, the spotlight also shines on the company's dividend history, yield, and growth rates. Using the data from GuruFocus, let's look into Procter & Gamble Co's dividend performance and assess its sustainability.
What Does Procter & Gamble Co Do?
This Powerful Chart Made Peter Lynch 29% A Year For 13 Years
How to calculate the intrinsic value of a stock?
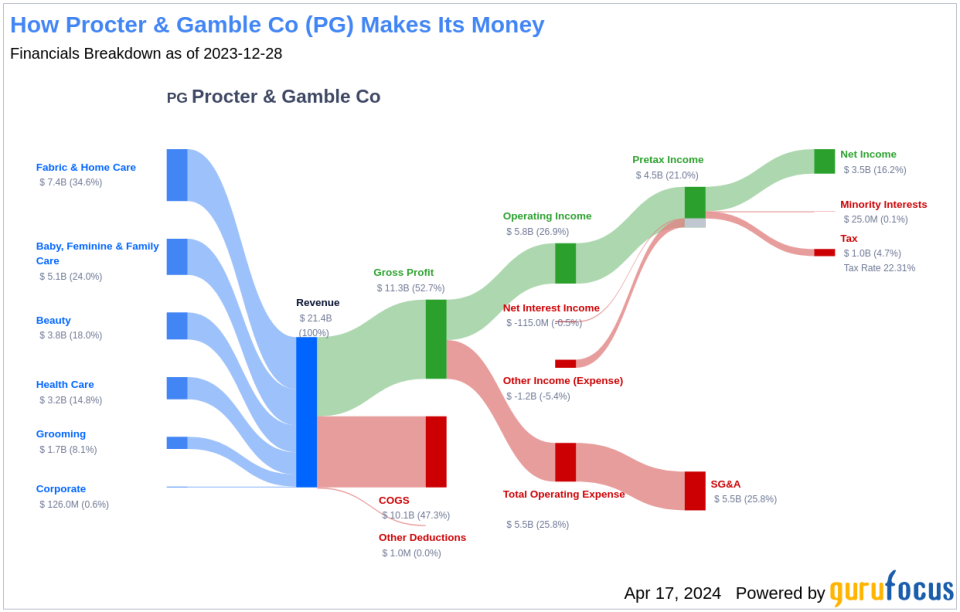
Since its founding in 1837, Procter & Gamble has become one of the world's largest consumer product manufacturers, generating more than $80 billion in annual sales. It operates with a lineup of leading brands, including more than 20 that generate north of $1 billion each in annual global sales, such as Tide laundry detergent, Charmin toilet paper, Pantene shampoo, and Pampers diapers. P&G sold its last remaining food brand, Pringles, to Kellogg in calendar 2012. Sales outside its home turf represent around 53% of the firm's consolidated total.
A Glimpse at Procter & Gamble Co's Dividend History
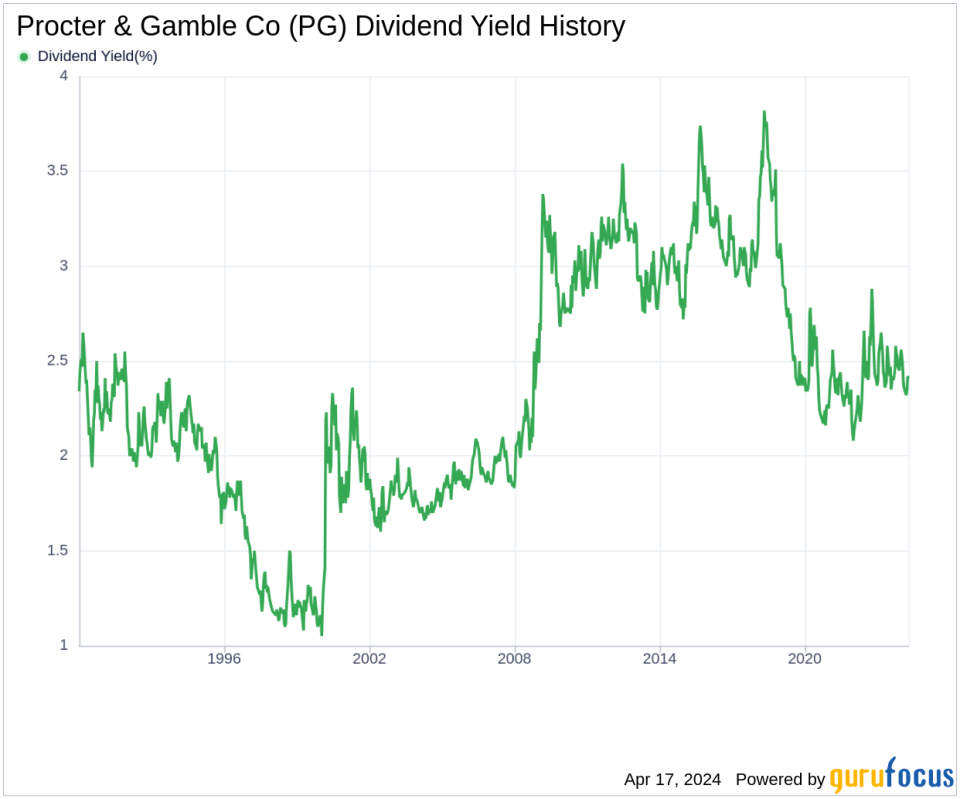
Procter & Gamble Co has maintained a consistent dividend payment record since 1957, distributing dividends on a quarterly basis. As a testament to its commitment to shareholder returns, Procter & Gamble Co has increased its dividend each year since 1957, earning the prestigious title of a dividend king. This accolade is reserved for companies that have managed to raise their dividends annually for at least the past 67 years.
Below is a chart showing annual Dividends Per Share for tracking historical trends. Unfortunately, the chart is currently unavailable.
Breaking Down Procter & Gamble Co's Dividend Yield and Growth
As of today, Procter & Gamble Co's trailing dividend yield stands at 2.41%, with a forward dividend yield of 2.60%. This indicates an expectation of increased dividend payments over the next 12 months. Over the past three years, the company's annual dividend growth rate was 6.70%, which decreased slightly to 6.00% per year over a five-year period. The ten-year annual dividends per share growth rate is at 4.50%. Consequently, the 5-year yield on cost for Procter & Gamble Co stock is approximately 3.23%.
The Sustainability Question: Payout Ratio and Profitability
To assess the sustainability of the dividend, one needs to evaluate the company's payout ratio. Procter & Gamble Co's dividend payout ratio is currently 0.58, indicating a balance between returning profits to shareholders and retaining earnings for growth. Furthermore, Procter & Gamble Co's profitability rank is 8 out of 10, suggesting strong profitability prospects. The company has also reported positive net income for each of the last ten years, reinforcing its financial stability.
Growth Metrics: The Future Outlook
Procter & Gamble Co's growth rank is 8 out of 10, reflecting a strong growth trajectory. The company's 3-year revenue growth rate of 6.90% per year, while underperforming approximately 50.72% of global competitors, still indicates a robust revenue model. However, the 3-year EPS growth rate of 4.80% per year and the 5-year EBITDA growth rate of 7.50% suggest that Procter & Gamble Co's earnings growth is lagging behind approximately half of its global competitors.
Concluding Thoughts on Procter & Gamble Co's Dividend Profile
Considering Procter & Gamble Co's consistent dividend growth, reasonable payout ratio, and strong profitability rank, the company's dividend payments appear sustainable. However, the growth metrics indicate that Procter & Gamble Co may need to seek new avenues for growth to maintain its dividend king status. Value investors should weigh these factors when considering Procter & Gamble Co as a potential addition to their portfolios. Will Procter & Gamble Co continue to adapt and thrive in a competitive landscape, sustaining its dividend growth for years to come?
GuruFocus Premium users can screen for high-dividend yield stocks using the High Dividend Yield Screener.
This article, generated by GuruFocus, is designed to provide general insights and is not tailored financial advice. Our commentary is rooted in historical data and analyst projections, utilizing an impartial methodology, and is not intended to serve as specific investment guidance. It does not formulate a recommendation to purchase or divest any stock and does not consider individual investment objectives or financial circumstances. Our objective is to deliver long-term, fundamental data-driven analysis. Be aware that our analysis might not incorporate the most recent, price-sensitive company announcements or qualitative information. GuruFocus holds no position in the stocks mentioned herein.
This article first appeared on GuruFocus.
