
 Yahoo Finance
 Preformed Line Products (NASDAQ:PLPC) Is Experiencing Growth In Returns On Capital
If you're not sure where to start when looking for the next multi-bagger, there are a few key trends you should keep an eye out for. Firstly, we'll want to see a proven return on capital employed (ROCE) that is increasing, and secondly, an expanding base of capital employed. Ultimately, this demonstrates that it's a business that is reinvesting profits at increasing rates of return. Speaking of which, we noticed some great changes in Preformed Line Products' (NASDAQ:PLPC) returns on capital, so let's have a look.
Understanding Return On Capital Employed (ROCE)
For those that aren't sure what ROCE is, it measures the amount of pre-tax profits a company can generate from the capital employed in its business. Analysts use this formula to calculate it for Preformed Line Products:
Return on Capital Employed = Earnings Before Interest and Tax (EBIT) ÷ (Total Assets - Current Liabilities)
0.17 = US$85m ÷ (US$603m - US$111m) (Based on the trailing twelve months to December 2023).
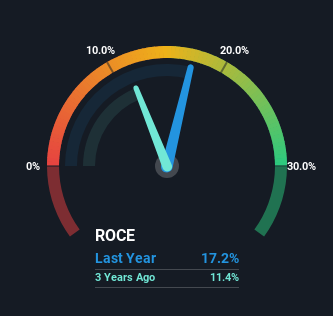
Therefore, Preformed Line Products has an ROCE of 17%. On its own, that's a standard return, however it's much better than the 14% generated by the Electrical industry.
See our latest analysis for Preformed Line Products
While the past is not representative of the future, it can be helpful to know how a company has performed historically, which is why we have this chart above. If you'd like to look at how Preformed Line Products has performed in the past in other metrics, you can view this free graph of Preformed Line Products' past earnings, revenue and cash flow.
What Does the ROCE Trend For Preformed Line Products Tell Us?
Investors would be pleased with what's happening at Preformed Line Products. Over the last five years, returns on capital employed have risen substantially to 17%. The company is effectively making more money per dollar of capital used, and it's worth noting that the amount of capital has increased too, by 70%. This can indicate that there's plenty of opportunities to invest capital internally and at ever higher rates, a combination that's common among multi-baggers.
What We Can Learn From Preformed Line Products' ROCE
All in all, it's terrific to see that Preformed Line Products is reaping the rewards from prior investments and is growing its capital base. Since the stock has returned a staggering 130% to shareholders over the last five years, it looks like investors are recognizing these changes. In light of that, we think it's worth looking further into this stock because if Preformed Line Products can keep these trends up, it could have a bright future ahead.
On the other side of ROCE, we have to consider valuation. That's why we have a FREE intrinsic value estimation for PLPC on our platform that is definitely worth checking out.
For those who like to invest in solid companies, check out this free list of companies with solid balance sheets and high returns on equity.
Have feedback on this article? Concerned about the content? Get in touch with us directly. Alternatively, email editorial-team (at) simplywallst.com.
This article by Simply Wall St is general in nature. We provide commentary based on historical data and analyst forecasts only using an unbiased methodology and our articles are not intended to be financial advice. It does not constitute a recommendation to buy or sell any stock, and does not take account of your objectives, or your financial situation. We aim to bring you long-term focused analysis driven by fundamental data. Note that our analysis may not factor in the latest price-sensitive company announcements or qualitative material. Simply Wall St has no position in any stocks mentioned.
