
 Yahoo Finance
 Polaris Infrastructure (TSE:PIF) Will Be Hoping To Turn Its Returns On Capital Around
There are a few key trends to look for if we want to identify the next multi-bagger. One common approach is to try and find a company with returns on capital employed (ROCE) that are increasing, in conjunction with a growing amount of capital employed. Basically this means that a company has profitable initiatives that it can continue to reinvest in, which is a trait of a compounding machine. However, after investigating Polaris Infrastructure (TSE:PIF), we don't think it's current trends fit the mold of a multi-bagger.
Return On Capital Employed (ROCE): What is it?
If you haven't worked with ROCE before, it measures the 'return' (pre-tax profit) a company generates from capital employed in its business. To calculate this metric for Polaris Infrastructure, this is the formula:
Return on Capital Employed = Earnings Before Interest and Tax (EBIT) ÷ (Total Assets - Current Liabilities)
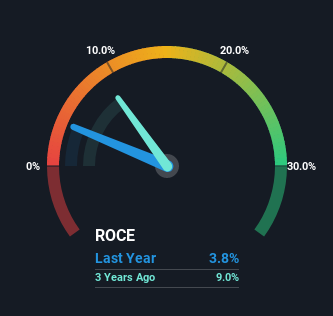
0.038 = US$18m ÷ (US$492m - US$17m) (Based on the trailing twelve months to March 2022).
Thus, Polaris Infrastructure has an ROCE of 3.8%. Even though it's in line with the industry average of 4.5%, it's still a low return by itself.
See our latest analysis for Polaris Infrastructure
In the above chart we have measured Polaris Infrastructure's prior ROCE against its prior performance, but the future is arguably more important. If you're interested, you can view the analysts predictions in our free report on analyst forecasts for the company.
The Trend Of ROCE
In terms of Polaris Infrastructure's historical ROCE movements, the trend isn't fantastic. Over the last five years, returns on capital have decreased to 3.8% from 6.0% five years ago. Given the business is employing more capital while revenue has slipped, this is a bit concerning. If this were to continue, you might be looking at a company that is trying to reinvest for growth but is actually losing market share since sales haven't increased.
The Bottom Line
In summary, we're somewhat concerned by Polaris Infrastructure's diminishing returns on increasing amounts of capital. But investors must be expecting an improvement of sorts because over the last five yearsthe stock has delivered a respectable 55% return. Regardless, we don't feel too comfortable with the fundamentals so we'd be steering clear of this stock for now.
On a separate note, we've found 3 warning signs for Polaris Infrastructure you'll probably want to know about.
While Polaris Infrastructure may not currently earn the highest returns, we've compiled a list of companies that currently earn more than 25% return on equity. Check out this free list here.
Have feedback on this article? Concerned about the content? Get in touch with us directly. Alternatively, email editorial-team (at) simplywallst.com.
This article by Simply Wall St is general in nature. We provide commentary based on historical data and analyst forecasts only using an unbiased methodology and our articles are not intended to be financial advice. It does not constitute a recommendation to buy or sell any stock, and does not take account of your objectives, or your financial situation. We aim to bring you long-term focused analysis driven by fundamental data. Note that our analysis may not factor in the latest price-sensitive company announcements or qualitative material. Simply Wall St has no position in any stocks mentioned.
