
 Yahoo Finance
 Polaris Infrastructure (TSE:PIF) Hasn't Managed To Accelerate Its Returns
If we want to find a potential multi-bagger, often there are underlying trends that can provide clues. Ideally, a business will show two trends; firstly a growing return on capital employed (ROCE) and secondly, an increasing amount of capital employed. Ultimately, this demonstrates that it's a business that is reinvesting profits at increasing rates of return. However, after briefly looking over the numbers, we don't think Polaris Infrastructure (TSE:PIF) has the makings of a multi-bagger going forward, but let's have a look at why that may be.
Return On Capital Employed (ROCE): What is it?
If you haven't worked with ROCE before, it measures the 'return' (pre-tax profit) a company generates from capital employed in its business. The formula for this calculation on Polaris Infrastructure is:
Return on Capital Employed = Earnings Before Interest and Tax (EBIT) ÷ (Total Assets - Current Liabilities)
0.04 = US$19m ÷ (US$510m - US$33m) (Based on the trailing twelve months to September 2021).
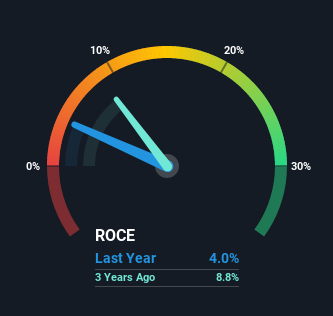
So, Polaris Infrastructure has an ROCE of 4.0%. In absolute terms, that's a low return and it also under-performs the Renewable Energy industry average of 5.0%.
Check out our latest analysis for Polaris Infrastructure
In the above chart we have measured Polaris Infrastructure's prior ROCE against its prior performance, but the future is arguably more important. If you'd like to see what analysts are forecasting going forward, you should check out our free report for Polaris Infrastructure.
What The Trend Of ROCE Can Tell Us
There are better returns on capital out there than what we're seeing at Polaris Infrastructure. The company has employed 21% more capital in the last five years, and the returns on that capital have remained stable at 4.0%. This poor ROCE doesn't inspire confidence right now, and with the increase in capital employed, it's evident that the business isn't deploying the funds into high return investments.
The Bottom Line On Polaris Infrastructure's ROCE
In conclusion, Polaris Infrastructure has been investing more capital into the business, but returns on that capital haven't increased. Since the stock has gained an impressive 46% over the last five years, investors must think there's better things to come. But if the trajectory of these underlying trends continue, we think the likelihood of it being a multi-bagger from here isn't high.
One more thing to note, we've identified 3 warning signs with Polaris Infrastructure and understanding them should be part of your investment process.
If you want to search for solid companies with great earnings, check out this free list of companies with good balance sheets and impressive returns on equity.
Have feedback on this article? Concerned about the content? Get in touch with us directly. Alternatively, email editorial-team (at) simplywallst.com.
This article by Simply Wall St is general in nature. We provide commentary based on historical data and analyst forecasts only using an unbiased methodology and our articles are not intended to be financial advice. It does not constitute a recommendation to buy or sell any stock, and does not take account of your objectives, or your financial situation. We aim to bring you long-term focused analysis driven by fundamental data. Note that our analysis may not factor in the latest price-sensitive company announcements or qualitative material. Simply Wall St has no position in any stocks mentioned.
