
 Yahoo Finance
 Should You Be Pleased About The CEO Pay At DIAGNOS Inc.'s (CVE:ADK)

André Larente became the CEO of DIAGNOS Inc. (CVE:ADK) in 2004. First, this article will compare CEO compensation with compensation at similar sized companies. After that, we will consider the growth in the business. Third, we'll reflect on the total return to shareholders over three years, as a second measure of business performance. The aim of all this is to consider the appropriateness of CEO pay levels.
Check out our latest analysis for DIAGNOS
How Does André Larente's Compensation Compare With Similar Sized Companies?
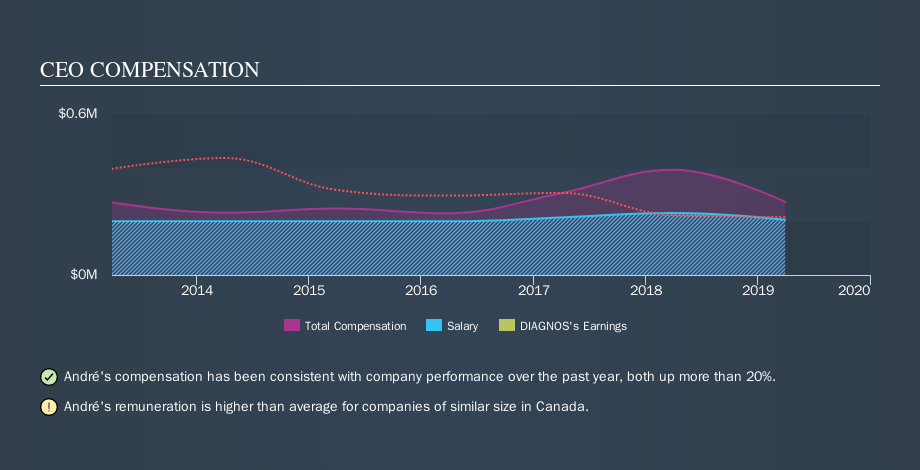
At the time of writing our data says that DIAGNOS Inc. has a market cap of CA$7.4m, and is paying total annual CEO compensation of CA$272k. (This figure is for the year to March 2019). That's actually a decrease on the year before. We think total compensation is more important but we note that the CEO salary is lower, at CA$206k. We looked at a group of companies with market capitalizations under CA$263m, and the median CEO total compensation was CA$144k.
Thus we can conclude that André Larente receives more in total compensation than the median of a group of companies in the same market, and of similar size to DIAGNOS Inc.. However, this doesn't necessarily mean the pay is too high. A closer look at the performance of the underlying business will give us a better idea about whether the pay is particularly generous.
You can see, below, how CEO compensation at DIAGNOS has changed over time.
Is DIAGNOS Inc. Growing?
On average over the last three years, DIAGNOS Inc. has grown earnings per share (EPS) by 10% each year (using a line of best fit). Its revenue is down -77% over last year.
Overall this is a positive result for shareholders, showing that the company has improved in recent years. While it would be good to see revenue growth, profits matter more in the end. Although we don't have analyst forecasts, shareholders might want to examine this detailed historical graph of earnings, revenue and cash flow.
Has DIAGNOS Inc. Been A Good Investment?
Since shareholders would have lost about 54% over three years, some DIAGNOS Inc. shareholders would surely be feeling negative emotions. It therefore might be upsetting for shareholders if the CEO were paid generously.
In Summary...
We compared the total CEO remuneration paid by DIAGNOS Inc., and compared it to remuneration at a group of similar sized companies. Our data suggests that it pays above the median CEO pay within that group.
However we must not forget that the EPS growth has been very strong over three years. On the other hand returns to investors over the same period have probably disappointed many. Considering the per share profit growth, but keeping in mind the weak returns, we'd need more time to form a view on CEO compensation. CEO compensation is one thing, but it is also interesting to check if the CEO is buying or selling DIAGNOS (free visualization of insider trades).
Arguably, business quality is much more important than CEO compensation levels. So check out this free list of interesting companies, that have HIGH return on equity and low debt.
We aim to bring you long-term focused research analysis driven by fundamental data. Note that our analysis may not factor in the latest price-sensitive company announcements or qualitative material.
If you spot an error that warrants correction, please contact the editor at editorial-team@simplywallst.com. This article by Simply Wall St is general in nature. It does not constitute a recommendation to buy or sell any stock, and does not take account of your objectives, or your financial situation. Simply Wall St has no position in the stocks mentioned. Thank you for reading.
