
 Yahoo Finance
 Should You Be Pleased About The CEO Pay At C-Com Satellite Systems Inc’s (CVE:CMI)

Leslie Klein has been the CEO of C-Com Satellite Systems Inc (CVE:CMI) since 1997. First, this article will compare CEO compensation with compensation at similar sized companies. Next, we’ll consider growth that the business demonstrates. Third, we’ll reflect on the total return to shareholders over three years, as a second measure of business performance. This method should give us information to assess how appropriately the company pays the CEO.
Check out our latest analysis for C-Com Satellite Systems
How Does Leslie Klein’s Compensation Compare With Similar Sized Companies?
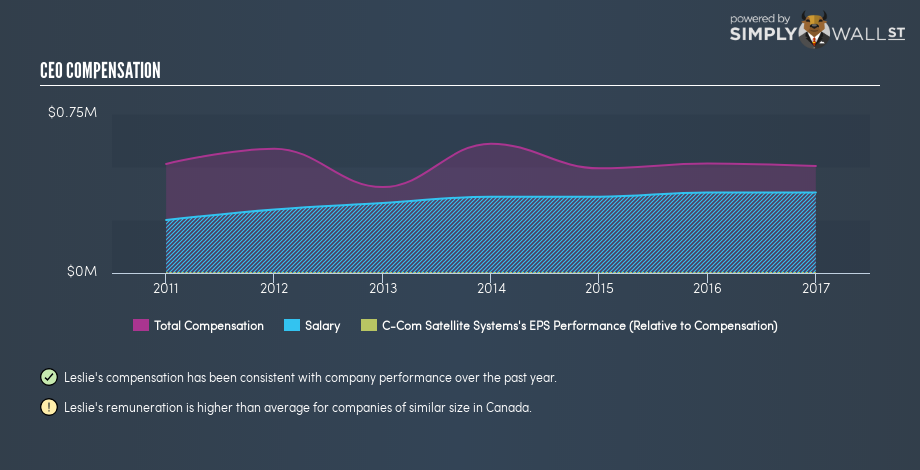
According to our data, C-Com Satellite Systems Inc has a market capitalization of CA$43m, and pays its CEO total annual compensation worth CA$505k. That’s actually a decrease on the year before. We took a group of companies with market capitalizations below CA$265m, and calculated the median CEO compensation to be CA$155k.
Thus we can conclude that Leslie Klein receives more in total compensation than the median of a group of companies in the same market, and of similar size to C-Com Satellite Systems Inc. However, this doesn’t necessarily mean the pay is too high. We can get a better idea of how generous the pay is by looking at the performance of the underlying business.
The graphic below shows how CEO compensation at C-Com Satellite Systems has changed from year to year.
Is C-Com Satellite Systems Inc Growing?
Over the last three years C-Com Satellite Systems Inc has shrunk its earnings per share by an average of 32% per year. In the last year, its revenue is up 7.9%.
Few shareholders would be pleased to read that earnings per share are lower over three years. And the modest revenue growth over 12 months isn’t much comfort against the reduced earnings per share. These factors suggest that the business performance wouldn’t really justify a high pay packet for the CEO.
Although we don’t have analyst forecasts, you could get a better understanding of its growth by checking out this more detailed historical graph of earnings, revenue and cash flow.
Has C-Com Satellite Systems Inc Been A Good Investment?
C-Com Satellite Systems Inc has served shareholders reasonably well, with a total return of 24% over three years. But they probably wouldn’t be so happy as to think the CEO should be paid more than is normal, for companies around this size.
In Summary…
We compared the total CEO remuneration paid by C-Com Satellite Systems Inc, and compared it to remuneration at a group of similar sized companies. As discussed above, we discovered that the company pays more than the median of that group.
Neither earnings per share nor revenue have been growing sufficiently fast to impress us, over the last three years.
While shareholder returns are acceptable, they don’t delight. So we doubt many shareholders would consider the CEO pay to be particularly modest! Shareholders may want to check for free if C-Com Satellite Systems Inc insiders are buying or selling shares.
Or you could feast your eyes on this interactive graph depicting past earnings, cash flow and revenue.
To help readers see past the short term volatility of the financial market, we aim to bring you a long-term focused research analysis purely driven by fundamental data. Note that our analysis does not factor in the latest price-sensitive company announcements.
The author is an independent contributor and at the time of publication had no position in the stocks mentioned. For errors that warrant correction please contact the editor at editorial-team@simplywallst.com.
