
 Yahoo Finance
 PLBY Group, Inc.'s (NASDAQ:PLBY) Share Price Could Signal Some Risk
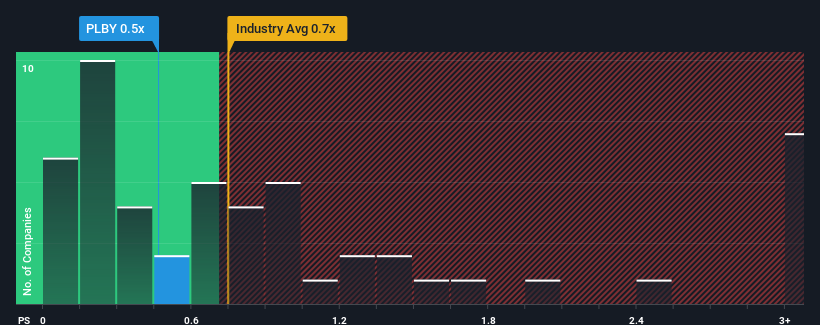
With a median price-to-sales (or "P/S") ratio of close to 0.7x in the Luxury industry in the United States, you could be forgiven for feeling indifferent about PLBY Group, Inc.'s (NASDAQ:PLBY) P/S ratio of 0.5x. However, investors might be overlooking a clear opportunity or potential setback if there is no rational basis for the P/S.
Check out our latest analysis for PLBY Group
What Does PLBY Group's P/S Mean For Shareholders?
Recent times haven't been great for PLBY Group as its revenue has been rising slower than most other companies. One possibility is that the P/S ratio is moderate because investors think this lacklustre revenue performance will turn around. However, if this isn't the case, investors might get caught out paying to much for the stock.
If you'd like to see what analysts are forecasting going forward, you should check out our free report on PLBY Group.
Do Revenue Forecasts Match The P/S Ratio?
In order to justify its P/S ratio, PLBY Group would need to produce growth that's similar to the industry.
If we review the last year of revenue growth, the company posted a worthy increase of 8.3%. The latest three year period has also seen an excellent 242% overall rise in revenue, aided somewhat by its short-term performance. Therefore, it's fair to say the revenue growth recently has been superb for the company.
Turning to the outlook, the next three years should generate growth of 3.0% per annum as estimated by the five analysts watching the company. Meanwhile, the rest of the industry is forecast to expand by 8.5% per annum, which is noticeably more attractive.
With this information, we find it interesting that PLBY Group is trading at a fairly similar P/S compared to the industry. Apparently many investors in the company are less bearish than analysts indicate and aren't willing to let go of their stock right now. Maintaining these prices will be difficult to achieve as this level of revenue growth is likely to weigh down the shares eventually.
The Bottom Line On PLBY Group's P/S
Using the price-to-sales ratio alone to determine if you should sell your stock isn't sensible, however it can be a practical guide to the company's future prospects.
When you consider that PLBY Group's revenue growth estimates are fairly muted compared to the broader industry, it's easy to see why we consider it unexpected to be trading at its current P/S ratio. When we see companies with a relatively weaker revenue outlook compared to the industry, we suspect the share price is at risk of declining, sending the moderate P/S lower. This places shareholders' investments at risk and potential investors in danger of paying an unnecessary premium.
Before you take the next step, you should know about the 3 warning signs for PLBY Group (1 can't be ignored!) that we have uncovered.
If companies with solid past earnings growth is up your alley, you may wish to see this free collection of other companies with strong earnings growth and low P/E ratios.
Have feedback on this article? Concerned about the content? Get in touch with us directly. Alternatively, email editorial-team (at) simplywallst.com.
This article by Simply Wall St is general in nature. We provide commentary based on historical data and analyst forecasts only using an unbiased methodology and our articles are not intended to be financial advice. It does not constitute a recommendation to buy or sell any stock, and does not take account of your objectives, or your financial situation. We aim to bring you long-term focused analysis driven by fundamental data. Note that our analysis may not factor in the latest price-sensitive company announcements or qualitative material. Simply Wall St has no position in any stocks mentioned.
Join A Paid User Research Session
You’ll receive a US$30 Amazon Gift card for 1 hour of your time while helping us build better investing tools for the individual investors like yourself. Sign up here
