
 Yahoo Finance
 A Piece Of The Puzzle Missing From Spectra Products Inc.'s (CVE:SSA) Share Price

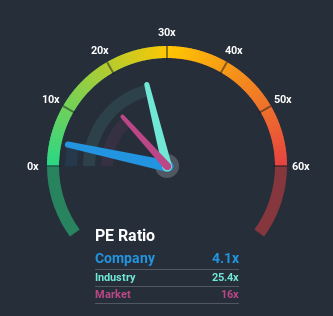
Spectra Products Inc.'s (CVE:SSA) price-to-earnings (or "P/E") ratio of 4.1x might make it look like a strong buy right now compared to the market in Canada, where around half of the companies have P/E ratios above 16x and even P/E's above 39x are quite common. Although, it's not wise to just take the P/E at face value as there may be an explanation why it's so limited.
With earnings growth that's exceedingly strong of late, Spectra Products has been doing very well. One possibility is that the P/E is low because investors think this strong earnings growth might actually underperform the broader market in the near future. If you like the company, you'd be hoping this isn't the case so that you could potentially pick up some stock while it's out of favour.
View our latest analysis for Spectra Products
Want the full picture on earnings, revenue and cash flow for the company? Then our free report on Spectra Products will help you shine a light on its historical performance.
Is There Any Growth For Spectra Products?
Spectra Products' P/E ratio would be typical for a company that's expected to deliver very poor growth or even falling earnings, and importantly, perform much worse than the market.
Retrospectively, the last year delivered an exceptional 77% gain to the company's bottom line. The strong recent performance means it was also able to grow EPS by 378% in total over the last three years. So we can start by confirming that the company has done a great job of growing earnings over that time.
Comparing that to the market, which is only predicted to deliver 5.3% growth in the next 12 months, the company's momentum is stronger based on recent medium-term annualised earnings results.
With this information, we find it odd that Spectra Products is trading at a P/E lower than the market. Apparently some shareholders believe the recent performance has exceeded its limits and have been accepting significantly lower selling prices.
The Final Word
The price-to-earnings ratio's power isn't primarily as a valuation instrument but rather to gauge current investor sentiment and future expectations.
Our examination of Spectra Products revealed its three-year earnings trends aren't contributing to its P/E anywhere near as much as we would have predicted, given they look better than current market expectations. There could be some major unobserved threats to earnings preventing the P/E ratio from matching this positive performance. It appears many are indeed anticipating earnings instability, because the persistence of these recent medium-term conditions would normally provide a boost to the share price.
It's always necessary to consider the ever-present spectre of investment risk. We've identified 3 warning signs with Spectra Products (at least 2 which don't sit too well with us), and understanding these should be part of your investment process.
If you're unsure about the strength of Spectra Products' business, why not explore our interactive list of stocks with solid business fundamentals for some other companies you may have missed.
This article by Simply Wall St is general in nature. It does not constitute a recommendation to buy or sell any stock, and does not take account of your objectives, or your financial situation. We aim to bring you long-term focused analysis driven by fundamental data. Note that our analysis may not factor in the latest price-sensitive company announcements or qualitative material. Simply Wall St has no position in any stocks mentioned.
Have feedback on this article? Concerned about the content? Get in touch with us directly. Alternatively, email editorial-team@simplywallst.com.
