
 Yahoo Finance
 Phoenix New Media Limited's (NYSE:FENG) Share Price Is Matching Sentiment Around Its Revenues
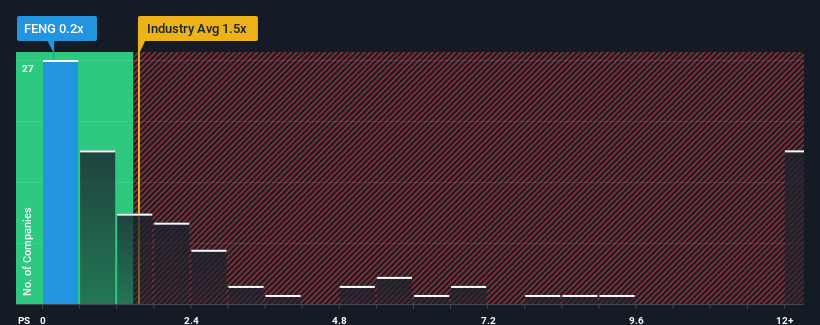
Phoenix New Media Limited's (NYSE:FENG) price-to-sales (or "P/S") ratio of 0.2x might make it look like a buy right now compared to the Interactive Media and Services industry in the United States, where around half of the companies have P/S ratios above 1.5x and even P/S above 4x are quite common. However, the P/S might be low for a reason and it requires further investigation to determine if it's justified.
Check out our latest analysis for Phoenix New Media
How Phoenix New Media Has Been Performing
As an illustration, revenue has deteriorated at Phoenix New Media over the last year, which is not ideal at all. Perhaps the market believes the recent revenue performance isn't good enough to keep up the industry, causing the P/S ratio to suffer. If you like the company, you'd be hoping this isn't the case so that you could potentially pick up some stock while it's out of favour.
Want the full picture on earnings, revenue and cash flow for the company? Then our free report on Phoenix New Media will help you shine a light on its historical performance.
Do Revenue Forecasts Match The Low P/S Ratio?
Phoenix New Media's P/S ratio would be typical for a company that's only expected to deliver limited growth, and importantly, perform worse than the industry.
Retrospectively, the last year delivered a frustrating 19% decrease to the company's top line. This means it has also seen a slide in revenue over the longer-term as revenue is down 51% in total over the last three years. Therefore, it's fair to say the revenue growth recently has been undesirable for the company.
In contrast to the company, the rest of the industry is expected to grow by 13% over the next year, which really puts the company's recent medium-term revenue decline into perspective.
With this information, we are not surprised that Phoenix New Media is trading at a P/S lower than the industry. Nonetheless, there's no guarantee the P/S has reached a floor yet with revenue going in reverse. Even just maintaining these prices could be difficult to achieve as recent revenue trends are already weighing down the shares.
What Does Phoenix New Media's P/S Mean For Investors?
It's argued the price-to-sales ratio is an inferior measure of value within certain industries, but it can be a powerful business sentiment indicator.
As we suspected, our examination of Phoenix New Media revealed its shrinking revenue over the medium-term is contributing to its low P/S, given the industry is set to grow. Right now shareholders are accepting the low P/S as they concede future revenue probably won't provide any pleasant surprises either. Unless the recent medium-term conditions improve, they will continue to form a barrier for the share price around these levels.
It is also worth noting that we have found 2 warning signs for Phoenix New Media (1 makes us a bit uncomfortable!) that you need to take into consideration.
If you're unsure about the strength of Phoenix New Media's business, why not explore our interactive list of stocks with solid business fundamentals for some other companies you may have missed.
Have feedback on this article? Concerned about the content? Get in touch with us directly. Alternatively, email editorial-team (at) simplywallst.com.
This article by Simply Wall St is general in nature. We provide commentary based on historical data and analyst forecasts only using an unbiased methodology and our articles are not intended to be financial advice. It does not constitute a recommendation to buy or sell any stock, and does not take account of your objectives, or your financial situation. We aim to bring you long-term focused analysis driven by fundamental data. Note that our analysis may not factor in the latest price-sensitive company announcements or qualitative material. Simply Wall St has no position in any stocks mentioned.
