
 Yahoo Finance
 PGG Wrightson's (NZSE:PGW) 2.3% YoY earnings expansion surpassed the shareholder returns over the past five years
PGG Wrightson Limited (NZSE:PGW) shareholders should be happy to see the share price up 17% in the last month. But over the last half decade, the stock has not performed well. You would have done a lot better buying an index fund, since the stock has dropped 65% in that half decade.
On a more encouraging note the company has added NZ$17m to its market cap in just the last 7 days, so let's see if we can determine what's driven the five-year loss for shareholders.
Check out our latest analysis for PGG Wrightson
To paraphrase Benjamin Graham: Over the short term the market is a voting machine, but over the long term it's a weighing machine. One way to examine how market sentiment has changed over time is to look at the interaction between a company's share price and its earnings per share (EPS).
During the unfortunate half decade during which the share price slipped, PGG Wrightson actually saw its earnings per share (EPS) improve by 12% per year. So it doesn't seem like EPS is a great guide to understanding how the market is valuing the stock. Alternatively, growth expectations may have been unreasonable in the past.
Due to the lack of correlation between the EPS growth and the falling share price, it's worth taking a look at other metrics to try to understand the share price movement.
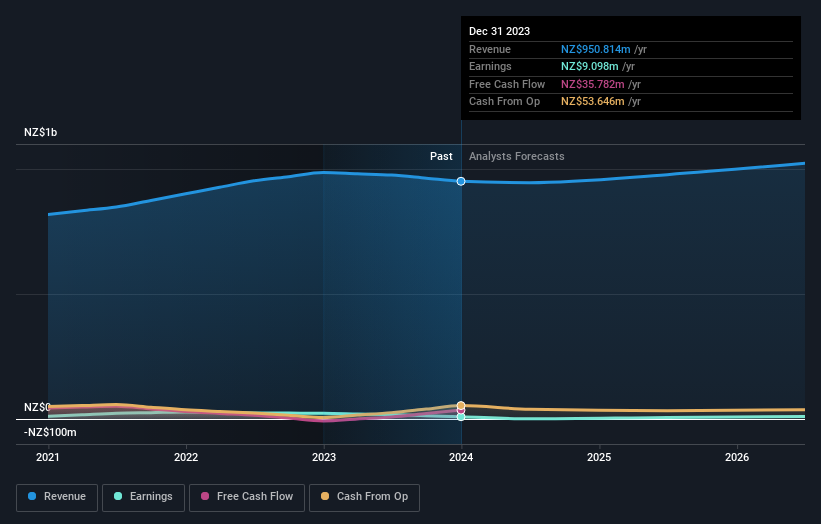
In contrast to the share price, revenue has actually increased by 5.3% a year in the five year period. A more detailed examination of the revenue and earnings may or may not explain why the share price languishes; there could be an opportunity.
You can see how earnings and revenue have changed over time in the image below (click on the chart to see the exact values).
Take a more thorough look at PGG Wrightson's financial health with this free report on its balance sheet.
What About The Total Shareholder Return (TSR)?
Investors should note that there's a difference between PGG Wrightson's total shareholder return (TSR) and its share price change, which we've covered above. Arguably the TSR is a more complete return calculation because it accounts for the value of dividends (as if they were reinvested), along with the hypothetical value of any discounted capital that have been offered to shareholders. PGG Wrightson's TSR of 11% for the 5 years exceeded its share price return, because it has paid dividends.
A Different Perspective
We regret to report that PGG Wrightson shareholders are down 53% for the year. Unfortunately, that's worse than the broader market decline of 2.0%. Having said that, it's inevitable that some stocks will be oversold in a falling market. The key is to keep your eyes on the fundamental developments. On the bright side, long term shareholders have made money, with a gain of 2% per year over half a decade. If the fundamental data continues to indicate long term sustainable growth, the current sell-off could be an opportunity worth considering. It's always interesting to track share price performance over the longer term. But to understand PGG Wrightson better, we need to consider many other factors. Case in point: We've spotted 3 warning signs for PGG Wrightson you should be aware of, and 1 of them is potentially serious.
But note: PGG Wrightson may not be the best stock to buy. So take a peek at this free list of interesting companies with past earnings growth (and further growth forecast).
Please note, the market returns quoted in this article reflect the market weighted average returns of stocks that currently trade on New Zealander exchanges.
Have feedback on this article? Concerned about the content? Get in touch with us directly. Alternatively, email editorial-team (at) simplywallst.com.
This article by Simply Wall St is general in nature. We provide commentary based on historical data and analyst forecasts only using an unbiased methodology and our articles are not intended to be financial advice. It does not constitute a recommendation to buy or sell any stock, and does not take account of your objectives, or your financial situation. We aim to bring you long-term focused analysis driven by fundamental data. Note that our analysis may not factor in the latest price-sensitive company announcements or qualitative material. Simply Wall St has no position in any stocks mentioned.
Have feedback on this article? Concerned about the content? Get in touch with us directly. Alternatively, email editorial-team@simplywallst.com
