
 Yahoo Finance
 Will Perspecta Inc (NYSE:PRSP) Continue To Underperform Its Industry?

The content of this article will benefit those of you who are starting to educate yourself about investing in the stock market and want to start learning about core concepts of fundamental analysis on practical examples from today’s market.
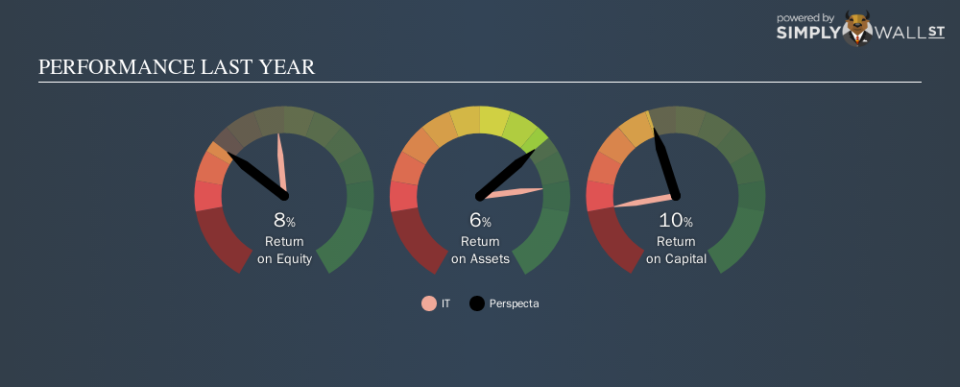
Perspecta Inc (NYSE:PRSP) generated a below-average return on equity of 7.62% in the past 12 months, while its industry returned 15.15%. An investor may attribute an inferior ROE to a relatively inefficient performance, and whilst this can often be the case, knowing the nuts and bolts of the ROE calculation may change that perspective and give you a deeper insight into PRSP’s past performance. Today I will look at how components such as financial leverage can influence ROE which may impact the sustainability of PRSP’s returns.
View our latest analysis for Perspecta
Peeling the layers of ROE – trisecting a company’s profitability
Return on Equity (ROE) weighs Perspecta’s profit against the level of its shareholders’ equity. An ROE of 7.62% implies $0.076 returned on every $1 invested. While a higher ROE is preferred in most cases, there are several other factors we should consider before drawing any conclusions.
Return on Equity = Net Profit ÷ Shareholders Equity
ROE is measured against cost of equity in order to determine the efficiency of Perspecta’s equity capital deployed. Its cost of equity is 9.78%. This means Perspecta’s returns actually do not cover its own cost of equity, with a discrepancy of -2.16%. This isn’t sustainable as it implies, very simply, that the company pays more for its capital than what it generates in return. ROE can be split up into three useful ratios: net profit margin, asset turnover, and financial leverage. This is called the Dupont Formula:
Dupont Formula
ROE = profit margin × asset turnover × financial leverage
ROE = (annual net profit ÷ sales) × (sales ÷ assets) × (assets ÷ shareholders’ equity)
ROE = annual net profit ÷ shareholders’ equity
Basically, profit margin measures how much of revenue trickles down into earnings which illustrates how efficient the business is with its cost management. Asset turnover shows how much revenue Perspecta can generate with its current asset base. The most interesting ratio, and reflective of sustainability of its ROE, is financial leverage. Since ROE can be artificially increased through excessive borrowing, we should check Perspecta’s historic debt-to-equity ratio. At 11.14%, Perspecta’s debt-to-equity ratio appears low and indicates that Perspecta still has room to increase leverage and grow its profits.

Next Steps:
ROE is one of many ratios which meaningfully dissects financial statements, which illustrates the quality of a company. Perspecta’s below-industry ROE is disappointing, furthermore, its returns were not even high enough to cover its own cost of equity. Although, its appropriate level of leverage means investors can be more confident in the sustainability of Perspecta’s return with a possible increase should the company decide to increase its debt levels. Although ROE can be a useful metric, it is only a small part of diligent research.
For Perspecta, there are three fundamental aspects you should further examine:
Financial Health: Does it have a healthy balance sheet? Take a look at our free balance sheet analysis with six simple checks on key factors like leverage and risk.
Valuation: What is Perspecta worth today? Is the stock undervalued, even when its growth outlook is factored into its intrinsic value? The intrinsic value infographic in our free research report helps visualize whether Perspecta is currently mispriced by the market.
Other High-Growth Alternatives : Are there other high-growth stocks you could be holding instead of Perspecta? Explore our interactive list of stocks with large growth potential to get an idea of what else is out there you may be missing!
To help readers see past the short term volatility of the financial market, we aim to bring you a long-term focused research analysis purely driven by fundamental data. Note that our analysis does not factor in the latest price-sensitive company announcements.
The author is an independent contributor and at the time of publication had no position in the stocks mentioned. For errors that warrant correction please contact the editor at editorial-team@simplywallst.com.
