
 Yahoo Finance
 Perpetual Energy's (TSE:PMT) Returns On Capital Are Heading Higher
Did you know there are some financial metrics that can provide clues of a potential multi-bagger? Firstly, we'll want to see a proven return on capital employed (ROCE) that is increasing, and secondly, an expanding base of capital employed. Ultimately, this demonstrates that it's a business that is reinvesting profits at increasing rates of return. Speaking of which, we noticed some great changes in Perpetual Energy's (TSE:PMT) returns on capital, so let's have a look.
What Is Return On Capital Employed (ROCE)?
For those who don't know, ROCE is a measure of a company's yearly pre-tax profit (its return), relative to the capital employed in the business. The formula for this calculation on Perpetual Energy is:
Return on Capital Employed = Earnings Before Interest and Tax (EBIT) ÷ (Total Assets - Current Liabilities)
0.12 = CA$22m ÷ (CA$209m - CA$22m) (Based on the trailing twelve months to June 2023).
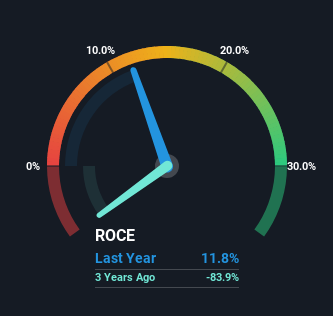
So, Perpetual Energy has an ROCE of 12%. In absolute terms, that's a pretty normal return, and it's somewhat close to the Oil and Gas industry average of 13%.
View our latest analysis for Perpetual Energy
In the above chart we have measured Perpetual Energy's prior ROCE against its prior performance, but the future is arguably more important. If you're interested, you can view the analysts predictions in our free report on analyst forecasts for the company.
What The Trend Of ROCE Can Tell Us
It's great to see that Perpetual Energy has started to generate some pre-tax earnings from prior investments. The company was generating losses five years ago, but now it's turned around, earning 12% which is no doubt a relief for some early shareholders. In regards to capital employed, Perpetual Energy is using 30% less capital than it was five years ago, which on the surface, can indicate that the business has become more efficient at generating these returns. This could potentially mean that the company is selling some of its assets.
One more thing to note, Perpetual Energy has decreased current liabilities to 11% of total assets over this period, which effectively reduces the amount of funding from suppliers or short-term creditors. So this improvement in ROCE has come from the business' underlying economics, which is great to see.
The Bottom Line On Perpetual Energy's ROCE
In the end, Perpetual Energy has proven it's capital allocation skills are good with those higher returns from less amount of capital. And investors seem to expect more of this going forward, since the stock has rewarded shareholders with a 94% return over the last five years. In light of that, we think it's worth looking further into this stock because if Perpetual Energy can keep these trends up, it could have a bright future ahead.
On a separate note, we've found 6 warning signs for Perpetual Energy you'll probably want to know about.
For those who like to invest in solid companies, check out this free list of companies with solid balance sheets and high returns on equity.
Have feedback on this article? Concerned about the content? Get in touch with us directly. Alternatively, email editorial-team (at) simplywallst.com.
This article by Simply Wall St is general in nature. We provide commentary based on historical data and analyst forecasts only using an unbiased methodology and our articles are not intended to be financial advice. It does not constitute a recommendation to buy or sell any stock, and does not take account of your objectives, or your financial situation. We aim to bring you long-term focused analysis driven by fundamental data. Note that our analysis may not factor in the latest price-sensitive company announcements or qualitative material. Simply Wall St has no position in any stocks mentioned.
