
 Yahoo Finance
 Perpetual Energy Full Year 2023 Earnings: EPS: CA$0.084 (vs CA$0.69 in FY 2022)
Perpetual Energy (TSE:PMT) Full Year 2023 Results
Key Financial Results
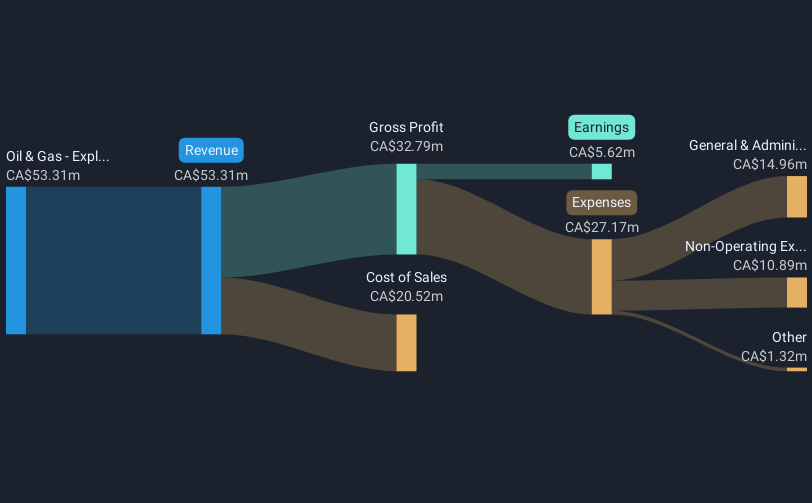
Revenue: CA$53.3m (down 40% from FY 2022).
Net income: CA$5.62m (down 87% from FY 2022).
Profit margin: 11% (down from 50% in FY 2022).
EPS: CA$0.084 (down from CA$0.69 in FY 2022).
PMT Production and Reserves
Oil reserves
Proven reserves: 0.006 MMbbls.
Gas reserves
Proven reserves: 73.198 Bcf.
LNG reserves
Proven reserves: 1.113 MMbbls.
Combined production
Oil equivalent production: 2.327 MMboe (2.367 MMboe in FY 2022).
All figures shown in the chart above are for the trailing 12 month (TTM) period
In the last 12 months, the only revenue segment was Oil & Gas - Exploration & Production contributing CA$53.3m. The largest operating expense was Depreciation & Amortisation (D&A) costs, amounting to CA$23.6m (87% of total expenses). Explore how PMT's revenue and expenses shape its earnings.
Perpetual Energy shares are up 24% from a week ago.
Risk Analysis
Before we wrap up, we've discovered 5 warning signs for Perpetual Energy that you should be aware of.
Have feedback on this article? Concerned about the content? Get in touch with us directly. Alternatively, email editorial-team (at) simplywallst.com.
This article by Simply Wall St is general in nature. We provide commentary based on historical data and analyst forecasts only using an unbiased methodology and our articles are not intended to be financial advice. It does not constitute a recommendation to buy or sell any stock, and does not take account of your objectives, or your financial situation. We aim to bring you long-term focused analysis driven by fundamental data. Note that our analysis may not factor in the latest price-sensitive company announcements or qualitative material. Simply Wall St has no position in any stocks mentioned.
