
 Yahoo Finance
 Paychex (NASDAQ:PAYX) Might Become A Compounding Machine
If you're not sure where to start when looking for the next multi-bagger, there are a few key trends you should keep an eye out for. Typically, we'll want to notice a trend of growing return on capital employed (ROCE) and alongside that, an expanding base of capital employed. Basically this means that a company has profitable initiatives that it can continue to reinvest in, which is a trait of a compounding machine. With that in mind, the ROCE of Paychex (NASDAQ:PAYX) looks attractive right now, so lets see what the trend of returns can tell us.
What Is Return On Capital Employed (ROCE)?
For those that aren't sure what ROCE is, it measures the amount of pre-tax profits a company can generate from the capital employed in its business. To calculate this metric for Paychex, this is the formula:
Return on Capital Employed = Earnings Before Interest and Tax (EBIT) ÷ (Total Assets - Current Liabilities)
0.43 = US$2.1b ÷ (US$13b - US$8.0b) (Based on the trailing twelve months to February 2024).
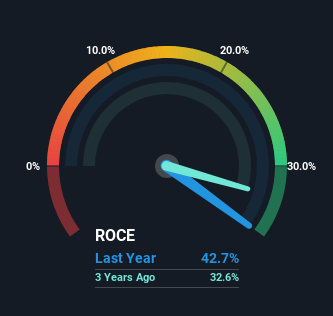
So, Paychex has an ROCE of 43%. That's a fantastic return and not only that, it outpaces the average of 13% earned by companies in a similar industry.
See our latest analysis for Paychex
Above you can see how the current ROCE for Paychex compares to its prior returns on capital, but there's only so much you can tell from the past. If you'd like to see what analysts are forecasting going forward, you should check out our free analyst report for Paychex .
So How Is Paychex's ROCE Trending?
Paychex deserves to be commended in regards to it's returns. Over the past five years, ROCE has remained relatively flat at around 43% and the business has deployed 32% more capital into its operations. With returns that high, it's great that the business can continually reinvest its money at such appealing rates of return. If these trends can continue, it wouldn't surprise us if the company became a multi-bagger.
Another thing to note, Paychex has a high ratio of current liabilities to total assets of 61%. This can bring about some risks because the company is basically operating with a rather large reliance on its suppliers or other sorts of short-term creditors. Ideally we'd like to see this reduce as that would mean fewer obligations bearing risks.
The Bottom Line On Paychex's ROCE
In summary, we're delighted to see that Paychex has been compounding returns by reinvesting at consistently high rates of return, as these are common traits of a multi-bagger. Therefore it's no surprise that shareholders have earned a respectable 73% return if they held over the last five years. So while the positive underlying trends may be accounted for by investors, we still think this stock is worth looking into further.
On the other side of ROCE, we have to consider valuation. That's why we have a FREE intrinsic value estimation for PAYX on our platform that is definitely worth checking out.
Paychex is not the only stock earning high returns. If you'd like to see more, check out our free list of companies earning high returns on equity with solid fundamentals.
Have feedback on this article? Concerned about the content? Get in touch with us directly. Alternatively, email editorial-team (at) simplywallst.com.
This article by Simply Wall St is general in nature. We provide commentary based on historical data and analyst forecasts only using an unbiased methodology and our articles are not intended to be financial advice. It does not constitute a recommendation to buy or sell any stock, and does not take account of your objectives, or your financial situation. We aim to bring you long-term focused analysis driven by fundamental data. Note that our analysis may not factor in the latest price-sensitive company announcements or qualitative material. Simply Wall St has no position in any stocks mentioned.
