
 Yahoo Finance
 Paychecks Are Getting Bigger in These Boomtowns
As cities with higher costs of living continue to become more and more expensive, it's not uncommon for people to seek alternative places to live. Boomtowns are such places because they offer incentives, such as a more affordable cost-of-living or a higher paycheck -- or both.
Read: These Are the 10 Most Overpriced Housing Markets in the US -- 5 Are in Florida
Next: How To Build Your Savings From Scratch
GOBankingRates analyzed U.S. cities with populations of 500,000 or less and determined boomtown status on increasing income and economic growth based on five-year changes, from 2016 to 2021, in the areas of population, number of housing units, per capita personal income and five-year per capita personal income growth. When you're considering where you should live, you'll want to consider these boomtowns that offer high salaries.
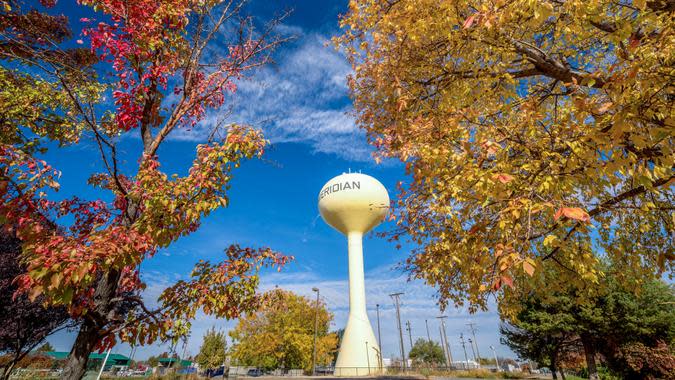
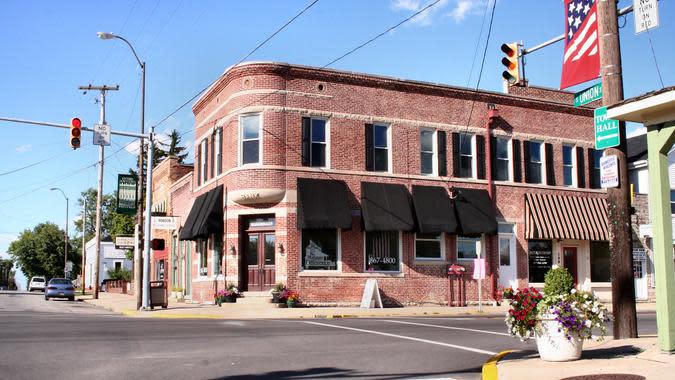
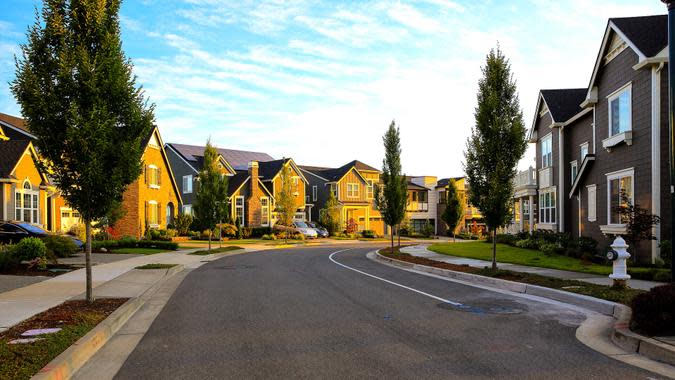
30. Meridian, Idaho
Income increase: 38.76%
Population increase: 30.57%
Housing increase: 30.67%
The first of two Idaho cities on the list, Meridian had the lowest 2016 median per capita income of studied cities at $28,872. But with an increase of 38.76%, the income climbed to a tad over $40,000 in 2021.
Look: 10 US Cities With Plenty of Jobs and Cheap Housing
Check Out: 5 Expensive Renovations Homeowners Always Regret
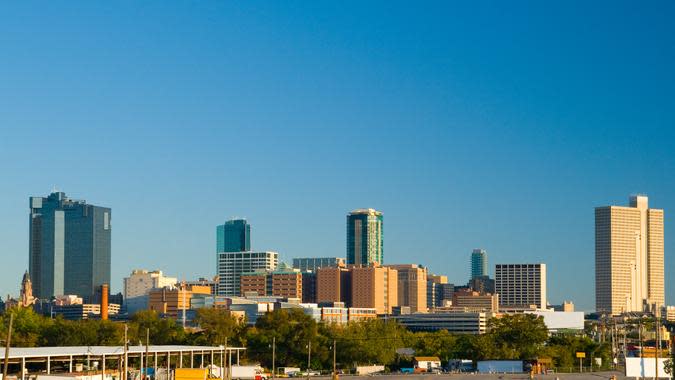
29. Southlake, Texas
Income increase: 22.31%
Population increase: 5.68%
Housing increase: 5.57%
Southlake landed this far down on the list due to its low percentage increases for population and housing as compared to other cities on the list. Its per capita income increase also landed in the lower third in the study at 22.31%.
Picture: Fort Worth, Texas
Take Our Poll: Are You Planning To Buy or Sell a House This Year?

28. Eagle, Idaho
Income increase: 41.76%
Population increase: 30.62%
Housing increase: 30.60%
As with Meridian, Eagle is a three-sector boomtown, growing by more than 30% in all three categories measured. The per capita income had a significant bump from about $40,500 to $57,500.
Picture: Boise, Idaho

27. Lexington, Massachusetts
Income increase: 37.38%
Population increase: 3.94%
Housing increase: 4.40%
A suburb of Boston, Lexington is famous as the site of the first shot of the Revolutionary War. As a historic, built-out city, it's no surprise that the population and housing increases are low. With an increase in per capita income of 37.38%, however, median incomes grew by $26,165 to just under $100,000.
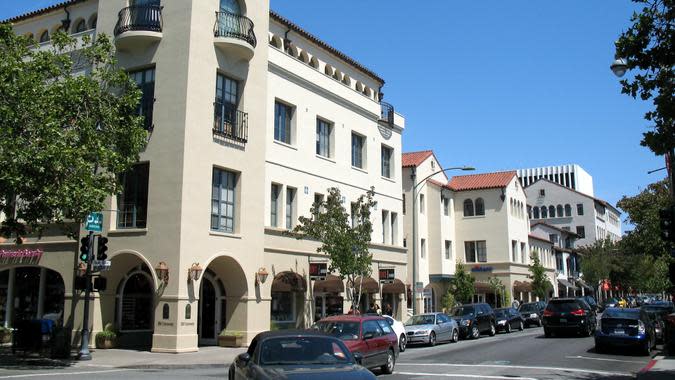
26. Mountain View, California
Income increase: 47.11%
Population increase: 4.54%
Housing increase: 4.62%
Mountain View is the home of Alphabet, Google's parent company, and a key player in Silicon Valley. Its per capita income growth of 47.11% was fifth highest on the list, even though its population and housing unit increases were relatively small at under 5%, like in Lexington.
25. University Park, Texas
Income increase: 19.80%
Population increase: 2.81%
Housing increase: 3.18%
University Park is a boomtown but ranks in the bottom five in terms of an increase in both population and housing at just around 3%. The per capita income rose almost 20%, however, over the five-year period - but that increase still ranked third lowest in the study.
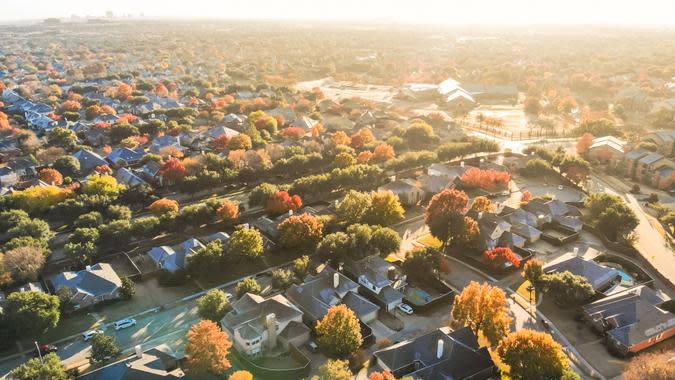
Picture: Dallas, Texas
Learn: Suze Orman Cautions Against Investing Emergency Funds in Two Common Places -- Here's Why
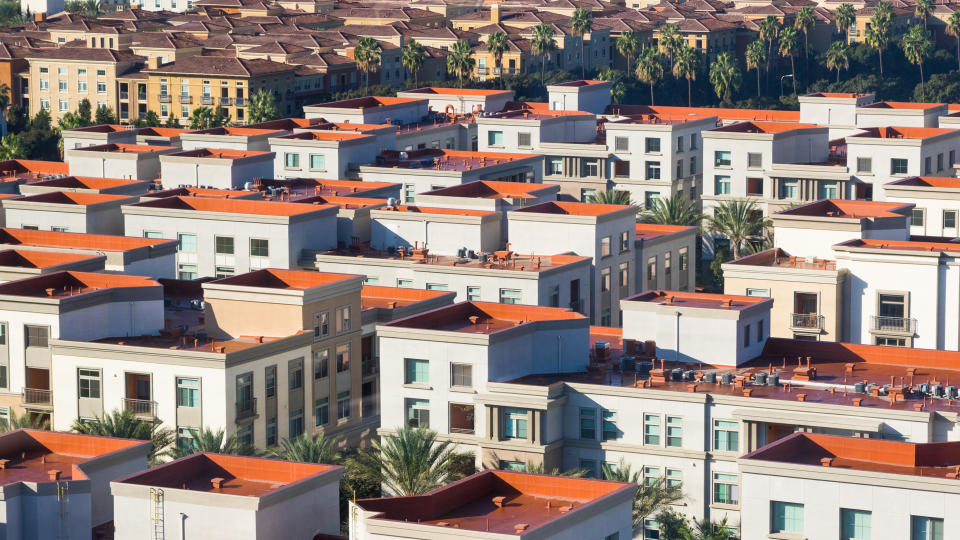
24. Irvine, California
Income increase: 19.31%
Population increase: 20.60%
Housing increase: 21.05%
With a population of nearly 300,000, Irvine has the most residents of any city on the list. Surprisingly, the population and the housing units increased by more than 20% over the five-year study period.

23. Des Moines, Iowa
Income increase: 31.74%
Population increase: 4.25%
Housing increase: 4.24%
The growth in population and housing was small over the past five years - an average of less than 1% per year. But income increased by 31.74%, which translates to a rise of nearly $25,000.
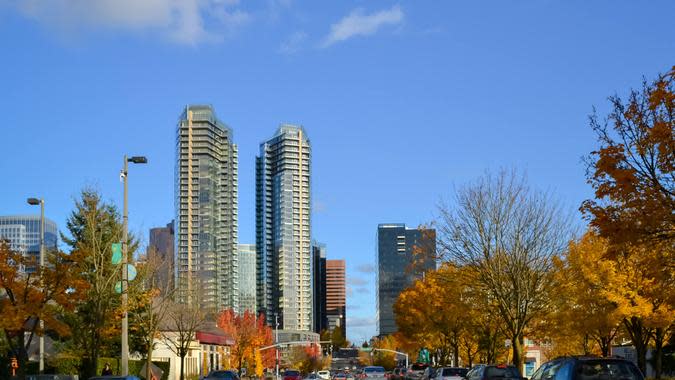
22. Redmond, Washington
Income increase: 36.66%
Population increase: 21.76%
Housing increase: 21.93%
Redmond is a tech hub, primarily known as the home of Microsoft. With a per capita income increase of nearly 37%, which translates to close to $20,000, the median income increased to just over $72,000.
21. Westfield, Indiana
Income increase: 45.14%
Population increase: 33.28%
Housing increase: 33.43%
As far as percentages of per capita income, population and housing go, Westfield had an increase of at least 33% across the board. Income led the way with a rise of about 45% over the study period.
Mortgage Interest Rate Forecast for 2023: When Will Rates Go Down?
20. Issaquah, Washington
Income increase: 59.70%
Population increase: 12.47%
Housing increase: 12.68%
Near Redmond, Issaquah is the home of the corporate headquarters of retail giant Costco, and its residents benefited from an income of increase of nearly 60%. Per capita income rose to $78,581 over the study period, in which housing units and population grew by about 12.5%.
19. Palo Alto, California
Income increase: 33.47%
Population increase: 2.96%
Housing increase: 2.87%
Home prices in Palo Alto, California, average close to $3.2 million, according to Zillow, which makes living in the home of Stanford University unattainable for most. That's likely why the population and housing increases were less than 3%, both in the bottom five on the list. The healthy per capita increase to $105,070 makes Palo Alto sixth-highest on the list, however.
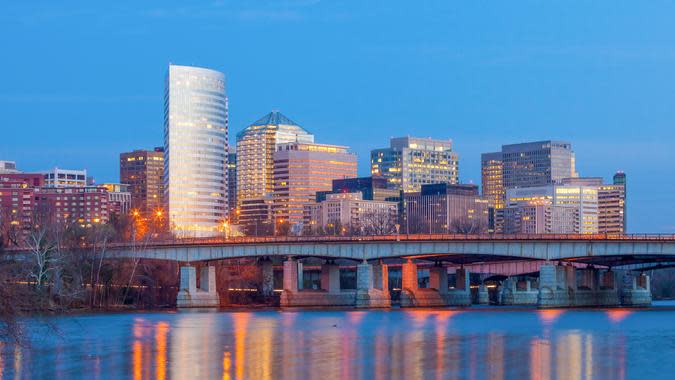
18. McLean, Virginia
Income increase: 18.40%
Population increase: 0.91%
Housing increase: 0.96%
McLean, a Washington, D.C., suburb, ranks at the bottom of the list regarding the percentage increase in population and housing at a minuscule less than 1%. It makes the list of boomtowns for its 18.4% increase in per capita income, which rose to $115,266. As impressive at that might sound, the increase still was the lowest in the study in terms of percentage.
Picture: Arlington, Virginia
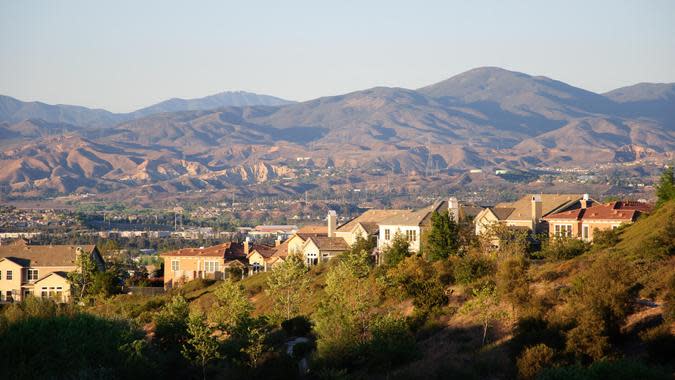
17. Santa Clarita, California
Income increase: 20.15%
Population increase: 26%
Housing increase: 26.21%
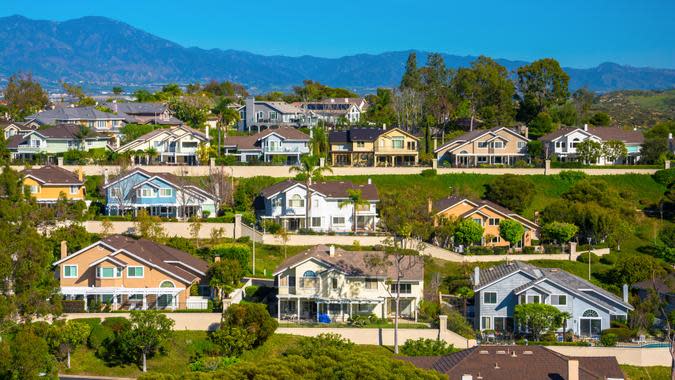
Santa Clarita, about 32 miles northwest of Los Angeles, gained 26% new residents and housing units. The population rose from 180,202 to 227,182 during the five-year period.
Housing Market 2023: Prices Are Now So High That Banks Are Losing Money on Mortgages

16. Bethesda, Maryland
Income increase: 23.44%
Population increase: 5.89%
Housing increase: 6.23%
While Bethesda grew by less than 7% in population and housing, its residents benefited from an increase in income from 2016 to 2021. The per capita income grew by $20,623 to $108,611 to rank fourth in the study.

15. Saratoga, California
Income increase: 36.79%
Population increase: 1.18%
Housing increase: 1.22%
In Saratoga, where Zillow estimates the average home costs $3.5 million, not many people moved in during the years of the study. In fact, the population growth of 1.18% was second-lowest on the list. However, the per capita income grew substantially, up from $79,870 to $108,776.
14. Dublin, California
Income increase: 32.97%
Population increase: 28.05%
Housing increase: 32.82%
One of six Northern California cities to appear in the study, Dublin added more housing units than it did people over the five-year time span. Housing outpaced people by about 1,700.
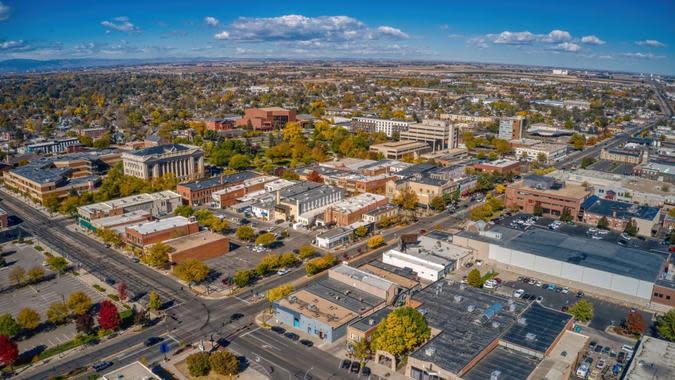
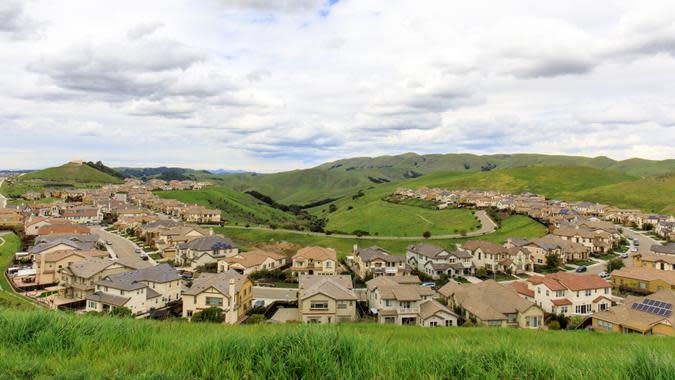
13. Windsor, Colorado
Income increase: 33.41%
Population increase: 51.14%
Housing increase: 51.46%
Windsor sits about an hour north of Denver and experienced big increases in per capita income, population and housing from 2016 to 2021. It experienced an influx of about 10,000 residents and added a similar number of housing units during the span.
Picture: Greeley, Colorado
See: 7 States Considering More Stimulus Checks in 2023
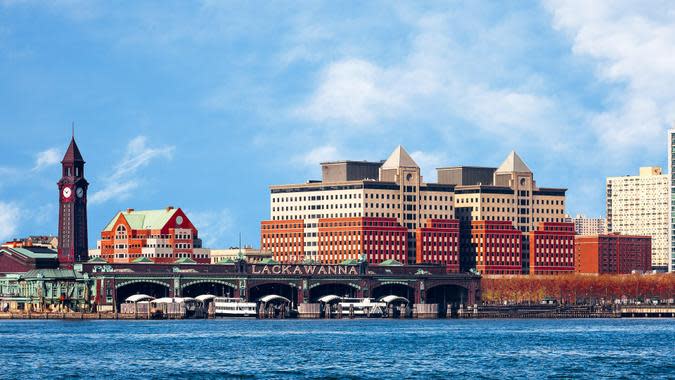
12. Hoboken, New Jersey
Income increase: 26.94%
Population increase: 11.73%
Housing increase: 11.72%
Hoboken packs a punch in just 1.25 square miles with a population of nearly 60,000. Despite its tiny area, Hoboken added about 6,000 residents and housing units each over the five-year study span.
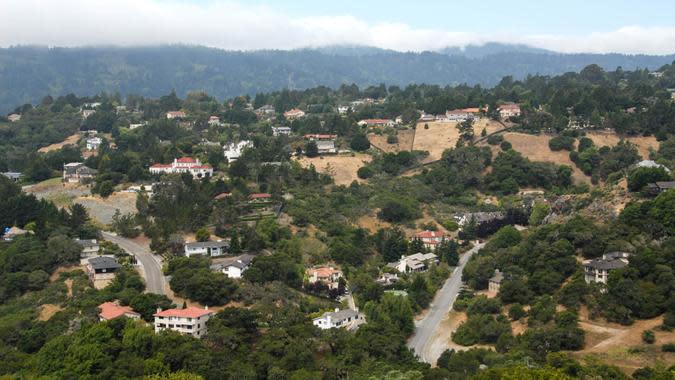
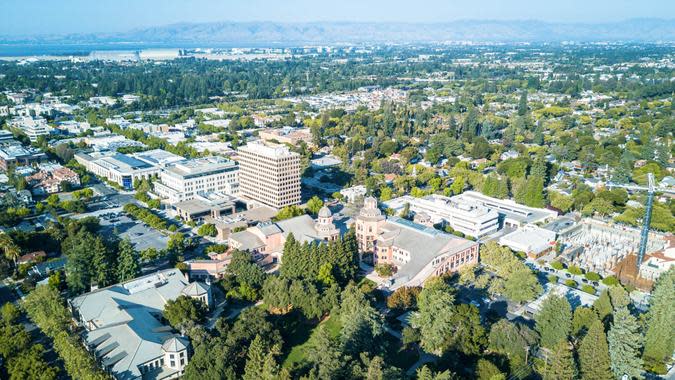
11. San Carlos, California
Income increase: 50.35%
Population increase: 3.31%
Housing increase: 3.94%
San Caelos ranks in the top five for the highest percentage increase in income. The city realized a $35,115 change over five years, which is the highest gain in the study.
Picture: Redwood City, California
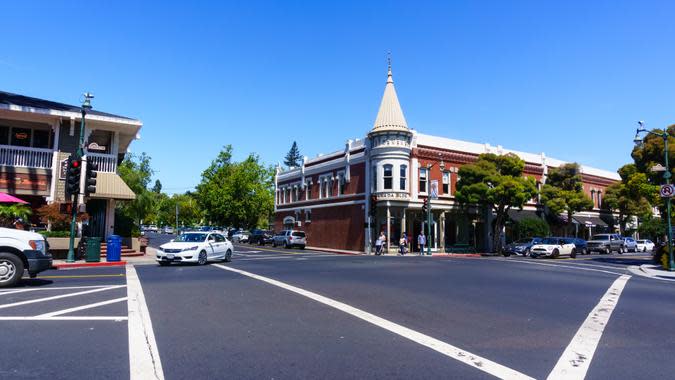
10. Los Gatos, California
Income increase: 38.98%
Population increase: 9.24%
Housing increase: 9.41%
The hefty income increase of 38.98% pushed Los Gatos' per capita income above $100,000. From 2016 to 2021, the median pay per capita grew from $74,855 to $104,035.
See:
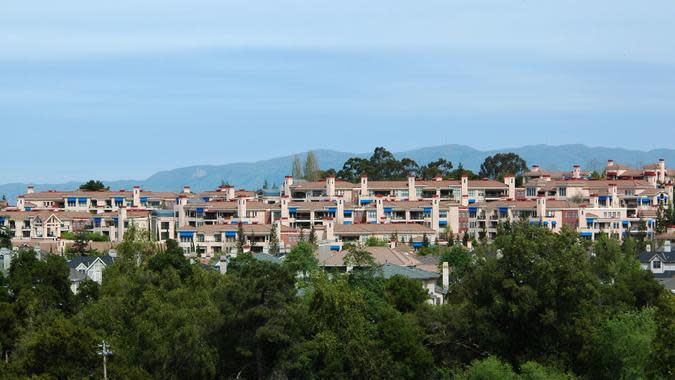
9. Los Altos, California
Income increase: 28.93%
Population increase: 4.38%
Housing increase: 4.41%
The well-to-do Bay Area community of Los Altos saw slight gains in population and housing, and its per capita income increase of 28.93% isn't the highest on the list. But from a starting point of $98,464 in 2016, the rise of nearly $28,000 in annual pay makes Los Altos the highest-paying city in the study.
Stimulus 2023: Updates To Know Now
8. Midlothian, Texas
Income increase: 45.98%
Population increase: 57.52%
Housing increase: 57.55%
Midlothian saw significant percentage increases across the board over the five-year study period. The income increase was substantial, with the median income in the Dallas suburb rising from $28,997 to $42.239.
Picture: Mansfield, Texas
7. Frisco, Texas
Income increase: 22.74%
Population increase: 32.61%
Housing increase: 32.69%
The fourth of six Texas cities on the list, the northern Dallas suburb had healthy increases in all three study categories. It added about 47,000 housing units, bringing the total to 192,857.
6. Leander, Texas
Income increase: 51.70%
Population increase: 59.36%
Housing increase: 59.36%
Leander experienced an increase in income, population and housing of at least 50% from 2016 to 2021. Its population ballooned from 36,204 to 57,696 during that span.
Picture: Cedar Park, Texas

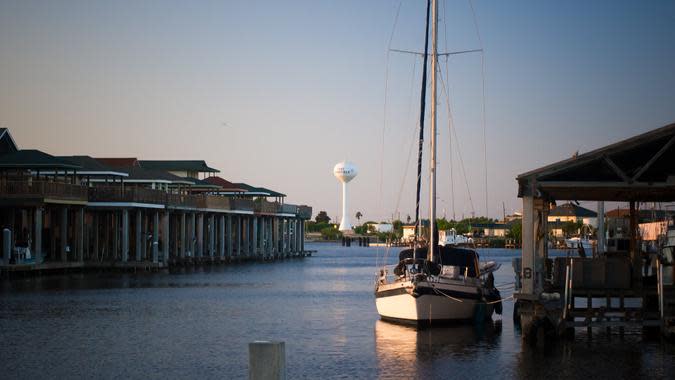
5. Bluffton, South Carolina
Income increase: 52.38%
Population increase: 75.05%
Housing increase: 74.30%
Bluffton is the last of the four cities in the study to experience an increase of per capita income of at least 50%, rising by $16,201 in 2021 from its 2016 starting point of $30,929. It experienced an increase in population and housing of about 75%, making it a true triple-threat boomtown.
Stimulus Update: New Proposal Could Give Americans Monthly $1,200 Checks
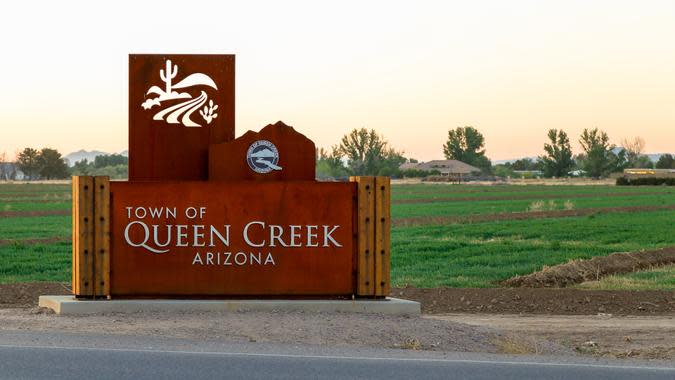
4. Queen Creek, Arizona
Income increase: 28.85%
Population increase: 87.13%
Housing increase: 87.08%
The sprawl in the Phoenix area has extended to Queen Creek, about 40 miles southeast of the capital city. Queen Cree, ranked No. 3 on the list in both percentage increase in population and new homes.
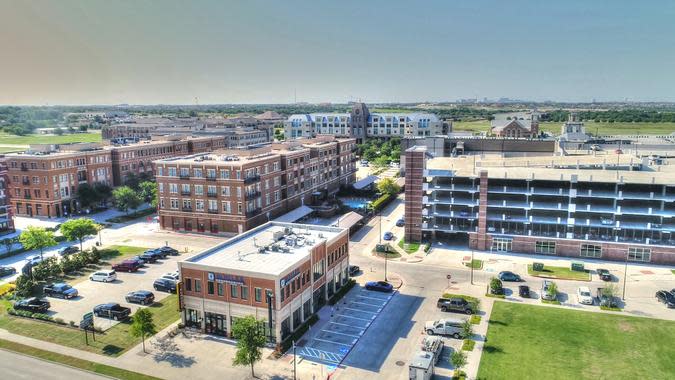
3. Prosper, Texas
Income increase: 32.52%
Population increase: 89.19%
Housing increase: 89.19%
Prosper, about 40 miles north of Dallas, almost doubled its number of residents in the five-year study span. It grew from 15,236 people to 28,825. Driven by a robust income increase, Prosper ranked second in the percentage growth of both population and housing.
Picture: Allen, Texas
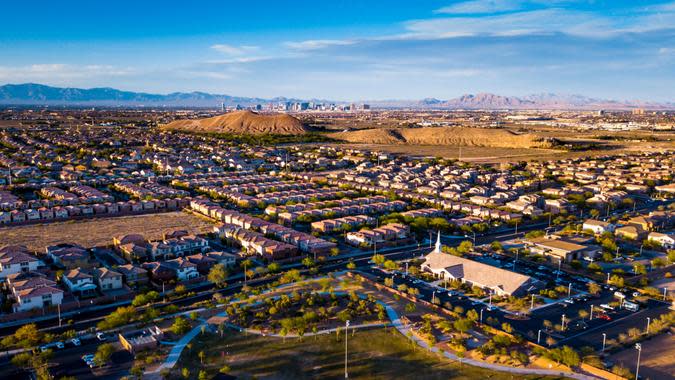
2. Enterprise, Nevada
Income increase: 21.98%
Population increase: 69.39%
Housing increase: 69.43%
Of all the cities on the list, Enterprise experienced the largest population increase from 2016 to 2021 in terms of new residents. The Las Vegas suburb grew by just shy of 90,000 people to 219,566 in that span. Its also added about the same number of new homes - the highest in the study.
1. Horizon West, Florida
Income increase: 19.97%
Population increase: 139.76%
Housing increase: 139.75%
Horizon West led the way with a whopping 139.76% population increase, rising from 22,538 residents in 2016 to 54,038. It also topped the study in percentage increase in terms of housing.
Picture: Orlando, Florida

Should You Live in a Boomtown?
People often move to boomtowns to enjoy a lower cost of living, a lower tax burden, job growth and the ability to afford a home.
For example, the lower cost of renting or buying a home could allow you to live downtown or in the inner suburbs -- areas that can prove financially out-of-reach in places such as New York, Boston, San Francisco and Los Angeles.
Because boomtowns grow at different rates in different areas, it's important to research factors such as growth and cost of living before you decide to move.
Whereas one boomtown might be an excellent place to relocate, another might be on the cusp of challenges, such as dealing with an insufficient infrastructure, that makes moving there less than desirable.
More From GOBankingRates
Jami Farkas contributed to the reporting of this article.
Methodology: For this piece, GOBankingRates took data from a December 2022 GOBankingRates study titled "Biggest Boomtowns in Every State" and found the following: GOBankingRates analyzed 571 qualified major U.S. cities along the following criteria in order to determine which "boomtowns" are seeing increasing incomes, as well as economic growth: (1) five-year percent change in total population, from 2016 to 2021, (2) five-year change in total population by number of people; (3) five-year change in amount of housing units by percentage; (4) five-year change in amount of housing units by number of units; (5) five-year change in amount of owner-occupied homes by percentage; (6) five-year change in amount of owner-occupied homes by number of homes; (7) five-year change in per capita income by percentage; (8) five-year change in per capita income by dollars; and (9) actual 2021 per capita income figure, all sourced from the 2021 and 2016 American Community Surveys. All factors were scored and combined with the lowest score being best. In final calculations factor (9) was weighted 3x, factors (1), (3), and (5) were weighted 2x; and factors (7) and (8) were weighted 0.5x. For a city to be considered among the final list of cities, their change in population, housing units and per capita personal incomes must be positive, and current per capita personal incomes must be higher than the current national level of $37,638. In order to focus on "boomtowns," a 500,000 population maximum restriction was used on the cities. All data was collected and is up to date as of April 18, 2023.
This article originally appeared on GOBankingRates.com: Paychecks Are Getting Bigger in These Boomtowns
