
 Yahoo Finance
 The past three years for NIO (NYSE:NIO) investors has not been profitable
NIO Inc. (NYSE:NIO) shareholders will doubtless be very grateful to see the share price up 31% in the last month. But only the myopic could ignore the astounding decline over three years. To wit, the share price sky-dived 86% in that time. So it's about time shareholders saw some gains. The thing to think about is whether the business has really turned around. We really feel for shareholders in this scenario. It's a good reminder of the importance of diversification, and it's worth keeping in mind there's more to life than money, anyway.
With that in mind, it's worth seeing if the company's underlying fundamentals have been the driver of long term performance, or if there are some discrepancies.
See our latest analysis for NIO
Given that NIO didn't make a profit in the last twelve months, we'll focus on revenue growth to form a quick view of its business development. Generally speaking, companies without profits are expected to grow revenue every year, and at a good clip. As you can imagine, fast revenue growth, when maintained, often leads to fast profit growth.
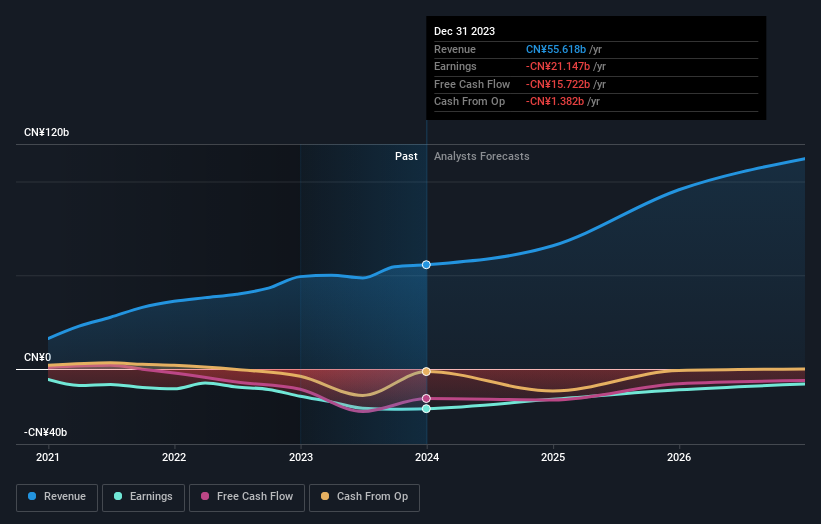
Over three years, NIO grew revenue at 31% per year. That is faster than most pre-profit companies. So on the face of it we're really surprised to see the share price down 23% a year in the same time period. You'd want to take a close look at the balance sheet, as well as the losses. Sometimes fast revenue growth doesn't lead to profits. If the company is low on cash, it may have to raise capital soon.
You can see below how earnings and revenue have changed over time (discover the exact values by clicking on the image).
NIO is a well known stock, with plenty of analyst coverage, suggesting some visibility into future growth. So it makes a lot of sense to check out what analysts think NIO will earn in the future (free analyst consensus estimates)
A Different Perspective
NIO shareholders are down 34% for the year, but the market itself is up 30%. However, keep in mind that even the best stocks will sometimes underperform the market over a twelve month period. On the bright side, long term shareholders have made money, with a gain of 8% per year over half a decade. If the fundamental data continues to indicate long term sustainable growth, the current sell-off could be an opportunity worth considering. I find it very interesting to look at share price over the long term as a proxy for business performance. But to truly gain insight, we need to consider other information, too. Even so, be aware that NIO is showing 2 warning signs in our investment analysis , you should know about...
If you would prefer to check out another company -- one with potentially superior financials -- then do not miss this free list of companies that have proven they can grow earnings.
Please note, the market returns quoted in this article reflect the market weighted average returns of stocks that currently trade on American exchanges.
Have feedback on this article? Concerned about the content? Get in touch with us directly. Alternatively, email editorial-team (at) simplywallst.com.
This article by Simply Wall St is general in nature. We provide commentary based on historical data and analyst forecasts only using an unbiased methodology and our articles are not intended to be financial advice. It does not constitute a recommendation to buy or sell any stock, and does not take account of your objectives, or your financial situation. We aim to bring you long-term focused analysis driven by fundamental data. Note that our analysis may not factor in the latest price-sensitive company announcements or qualitative material. Simply Wall St has no position in any stocks mentioned.
