
 Yahoo Finance
 The past three years for boohoo group (LON:BOO) investors has not been profitable
As an investor, mistakes are inevitable. But you want to avoid the really big losses like the plague. So take a moment to sympathize with the long term shareholders of boohoo group plc (LON:BOO), who have seen the share price tank a massive 89% over a three year period. That'd be enough to cause even the strongest minds some disquiet. We really hope anyone holding through that price crash has a diversified portfolio. Even when you lose money, you don't have to lose the lesson.
So let's have a look and see if the longer term performance of the company has been in line with the underlying business' progress.
See our latest analysis for boohoo group
Given that boohoo group didn't make a profit in the last twelve months, we'll focus on revenue growth to form a quick view of its business development. Shareholders of unprofitable companies usually desire strong revenue growth. As you can imagine, fast revenue growth, when maintained, often leads to fast profit growth.
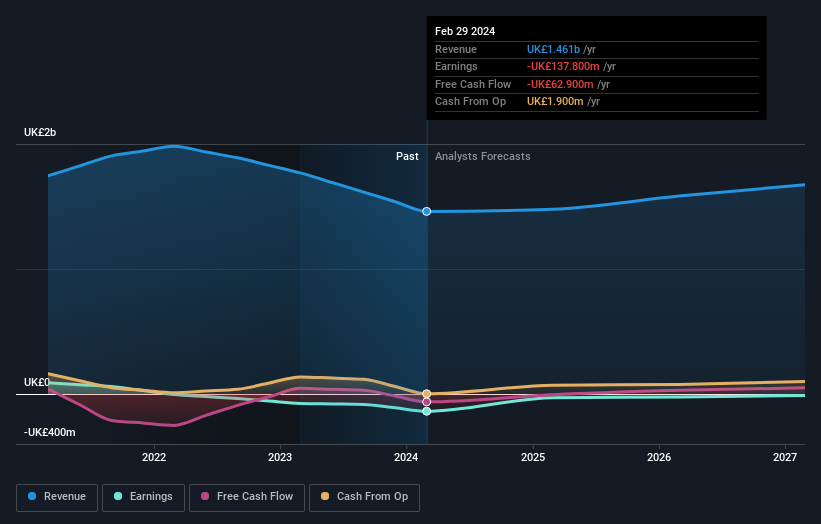
In the last three years boohoo group saw its revenue shrink by 6.9% per year. That is not a good result. The share price fall of 24% (per year, over three years) is a stern reminder that money-losing companies are expected to grow revenue. We're generally averse to companies with declining revenues, but we're not alone in that. There's no more than a snowball's chance in hell that share price will head back to its old highs, in the short term.
The image below shows how earnings and revenue have tracked over time (if you click on the image you can see greater detail).
boohoo group is well known by investors, and plenty of clever analysts have tried to predict the future profit levels. If you are thinking of buying or selling boohoo group stock, you should check out this free report showing analyst consensus estimates for future profits.
A Different Perspective
Investors in boohoo group had a tough year, with a total loss of 11%, against a market gain of about 10%. However, keep in mind that even the best stocks will sometimes underperform the market over a twelve month period. However, the loss over the last year isn't as bad as the 13% per annum loss investors have suffered over the last half decade. We would want clear information suggesting the company will grow, before taking the view that the share price will stabilize. I find it very interesting to look at share price over the long term as a proxy for business performance. But to truly gain insight, we need to consider other information, too. Even so, be aware that boohoo group is showing 1 warning sign in our investment analysis , you should know about...
But note: boohoo group may not be the best stock to buy. So take a peek at this free list of interesting companies with past earnings growth (and further growth forecast).
Please note, the market returns quoted in this article reflect the market weighted average returns of stocks that currently trade on British exchanges.
Have feedback on this article? Concerned about the content? Get in touch with us directly. Alternatively, email editorial-team (at) simplywallst.com.
This article by Simply Wall St is general in nature. We provide commentary based on historical data and analyst forecasts only using an unbiased methodology and our articles are not intended to be financial advice. It does not constitute a recommendation to buy or sell any stock, and does not take account of your objectives, or your financial situation. We aim to bring you long-term focused analysis driven by fundamental data. Note that our analysis may not factor in the latest price-sensitive company announcements or qualitative material. Simply Wall St has no position in any stocks mentioned.
