
 Yahoo Finance
 The past three years for AMMO (NASDAQ:POWW) investors has not been profitable
AMMO, Inc. (NASDAQ:POWW) shareholders should be happy to see the share price up 27% in the last quarter. But that doesn't change the fact that the returns over the last three years have been disappointing. In that time, the share price dropped 57%. So the improvement may be a real relief to some. While many would remain nervous, there could be further gains if the business can put its best foot forward.
Since shareholders are down over the longer term, lets look at the underlying fundamentals over the that time and see if they've been consistent with returns.
View our latest analysis for AMMO
AMMO wasn't profitable in the last twelve months, it is unlikely we'll see a strong correlation between its share price and its earnings per share (EPS). Arguably revenue is our next best option. Shareholders of unprofitable companies usually desire strong revenue growth. That's because it's hard to be confident a company will be sustainable if revenue growth is negligible, and it never makes a profit.
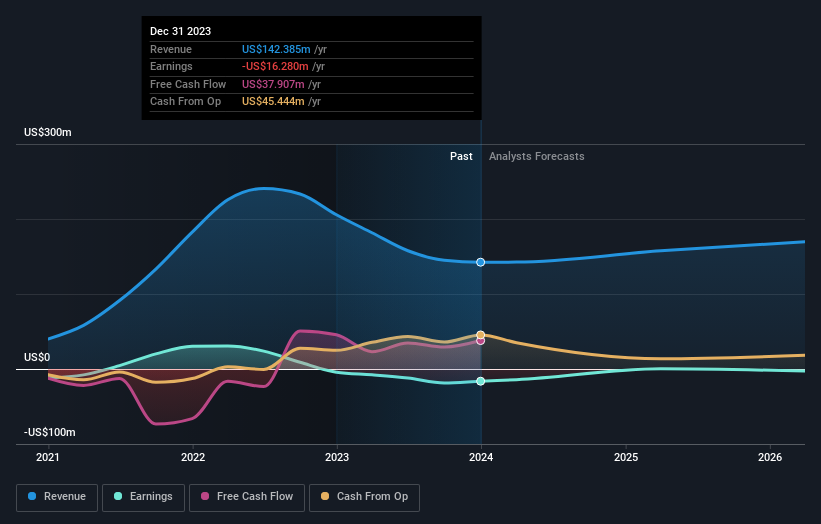
Over three years, AMMO grew revenue at 21% per year. That's well above most other pre-profit companies. The share price has moved in quite the opposite direction, down 16% over that time, a bad result. It seems likely that the market is worried about the continual losses. When we see revenue growth, paired with a falling share price, we can't help wonder if there is an opportunity for those who are willing to dig deeper.
You can see how earnings and revenue have changed over time in the image below (click on the chart to see the exact values).
It's probably worth noting that the CEO is paid less than the median at similar sized companies. But while CEO remuneration is always worth checking, the really important question is whether the company can grow earnings going forward. You can see what analysts are predicting for AMMO in this interactive graph of future profit estimates.
A Different Perspective
It's good to see that AMMO has rewarded shareholders with a total shareholder return of 35% in the last twelve months. That certainly beats the loss of about 1.9% per year over the last half decade. This makes us a little wary, but the business might have turned around its fortunes. It's always interesting to track share price performance over the longer term. But to understand AMMO better, we need to consider many other factors. Even so, be aware that AMMO is showing 2 warning signs in our investment analysis , you should know about...
If you are like me, then you will not want to miss this free list of growing companies that insiders are buying.
Please note, the market returns quoted in this article reflect the market weighted average returns of stocks that currently trade on American exchanges.
Have feedback on this article? Concerned about the content? Get in touch with us directly. Alternatively, email editorial-team (at) simplywallst.com.
This article by Simply Wall St is general in nature. We provide commentary based on historical data and analyst forecasts only using an unbiased methodology and our articles are not intended to be financial advice. It does not constitute a recommendation to buy or sell any stock, and does not take account of your objectives, or your financial situation. We aim to bring you long-term focused analysis driven by fundamental data. Note that our analysis may not factor in the latest price-sensitive company announcements or qualitative material. Simply Wall St has no position in any stocks mentioned.
