
 Yahoo Finance
 The past year for SpartanNash (NASDAQ:SPTN) investors has not been profitable
Investors can approximate the average market return by buying an index fund. But if you buy individual stocks, you can do both better or worse than that. For example, the SpartanNash Company (NASDAQ:SPTN) share price is down 21% in the last year. That's disappointing when you consider the market returned 21%. Longer term investors have fared much better, since the share price is up 2.1% in three years. Furthermore, it's down 13% in about a quarter. That's not much fun for holders.
So let's have a look and see if the longer term performance of the company has been in line with the underlying business' progress.
See our latest analysis for SpartanNash
To quote Buffett, 'Ships will sail around the world but the Flat Earth Society will flourish. There will continue to be wide discrepancies between price and value in the marketplace...' One imperfect but simple way to consider how the market perception of a company has shifted is to compare the change in the earnings per share (EPS) with the share price movement.
Even though the SpartanNash share price is down over the year, its EPS actually improved. It could be that the share price was previously over-hyped.
It's surprising to see the share price fall so much, despite the improved EPS. But we might find some different metrics explain the share price movements better.
We don't see any weakness in the SpartanNash's dividend so the steady payout can't really explain the share price drop. From what we can see, revenue is pretty flat, so that doesn't really explain the share price drop. Unless, of course, the market was expecting a revenue uptick.
The company's revenue and earnings (over time) are depicted in the image below (click to see the exact numbers).
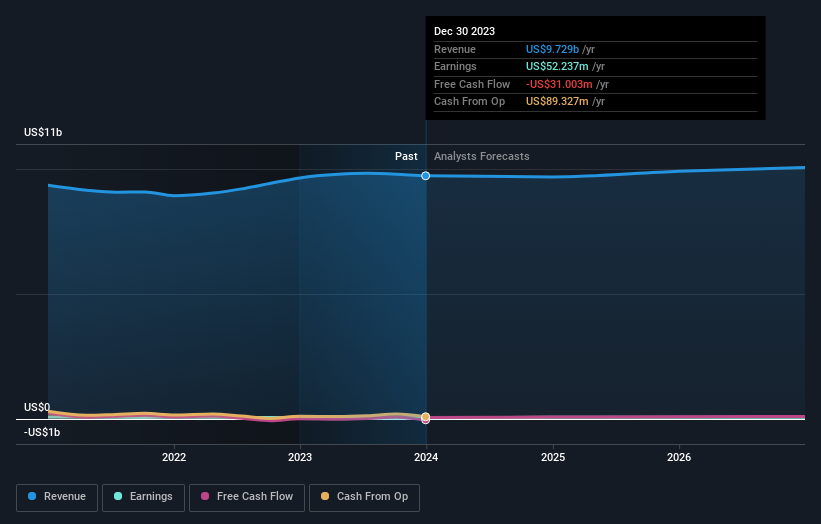
We know that SpartanNash has improved its bottom line lately, but what does the future have in store? You can see what analysts are predicting for SpartanNash in this interactive graph of future profit estimates.
What About Dividends?
As well as measuring the share price return, investors should also consider the total shareholder return (TSR). Whereas the share price return only reflects the change in the share price, the TSR includes the value of dividends (assuming they were reinvested) and the benefit of any discounted capital raising or spin-off. Arguably, the TSR gives a more comprehensive picture of the return generated by a stock. We note that for SpartanNash the TSR over the last 1 year was -18%, which is better than the share price return mentioned above. And there's no prize for guessing that the dividend payments largely explain the divergence!
A Different Perspective
While the broader market gained around 21% in the last year, SpartanNash shareholders lost 18% (even including dividends). Even the share prices of good stocks drop sometimes, but we want to see improvements in the fundamental metrics of a business, before getting too interested. Longer term investors wouldn't be so upset, since they would have made 8%, each year, over five years. If the fundamental data continues to indicate long term sustainable growth, the current sell-off could be an opportunity worth considering. I find it very interesting to look at share price over the long term as a proxy for business performance. But to truly gain insight, we need to consider other information, too. Case in point: We've spotted 4 warning signs for SpartanNash you should be aware of, and 1 of them is a bit unpleasant.
If you like to buy stocks alongside management, then you might just love this free list of companies. (Hint: insiders have been buying them).
Please note, the market returns quoted in this article reflect the market weighted average returns of stocks that currently trade on American exchanges.
Have feedback on this article? Concerned about the content? Get in touch with us directly. Alternatively, email editorial-team (at) simplywallst.com.
This article by Simply Wall St is general in nature. We provide commentary based on historical data and analyst forecasts only using an unbiased methodology and our articles are not intended to be financial advice. It does not constitute a recommendation to buy or sell any stock, and does not take account of your objectives, or your financial situation. We aim to bring you long-term focused analysis driven by fundamental data. Note that our analysis may not factor in the latest price-sensitive company announcements or qualitative material. Simply Wall St has no position in any stocks mentioned.
