
 Yahoo Finance
 The past year for Majestic Gold (CVE:MJS) investors has not been profitable
The simplest way to benefit from a rising market is to buy an index fund. When you buy individual stocks, you can make higher profits, but you also face the risk of under-performance. For example, the Majestic Gold Corp. (CVE:MJS) share price is down 45% in the last year. That contrasts poorly with the market return of 15%. On the other hand, the stock is actually up 20% over three years.
So let's have a look and see if the longer term performance of the company has been in line with the underlying business' progress.
See our latest analysis for Majestic Gold
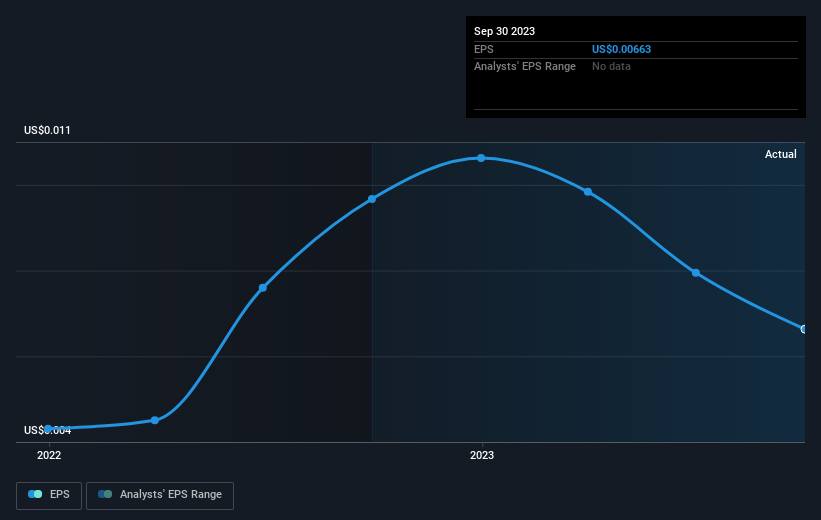
While the efficient markets hypothesis continues to be taught by some, it has been proven that markets are over-reactive dynamic systems, and investors are not always rational. One imperfect but simple way to consider how the market perception of a company has shifted is to compare the change in the earnings per share (EPS) with the share price movement.
Unhappily, Majestic Gold had to report a 31% decline in EPS over the last year. This reduction in EPS is not as bad as the 45% share price fall. Unsurprisingly, given the lack of EPS growth, the market seems to be more cautious about the stock. The less favorable sentiment is reflected in its current P/E ratio of 6.71.
The image below shows how EPS has tracked over time (if you click on the image you can see greater detail).
We're pleased to report that the CEO is remunerated more modestly than most CEOs at similarly capitalized companies. It's always worth keeping an eye on CEO pay, but a more important question is whether the company will grow earnings throughout the years. Dive deeper into the earnings by checking this interactive graph of Majestic Gold's earnings, revenue and cash flow.
A Different Perspective
Majestic Gold shareholders are down 45% for the year, but the market itself is up 15%. Even the share prices of good stocks drop sometimes, but we want to see improvements in the fundamental metrics of a business, before getting too interested. Regrettably, last year's performance caps off a bad run, with the shareholders facing a total loss of 1.5% per year over five years. We realise that Baron Rothschild has said investors should "buy when there is blood on the streets", but we caution that investors should first be sure they are buying a high quality business. It's always interesting to track share price performance over the longer term. But to understand Majestic Gold better, we need to consider many other factors. Even so, be aware that Majestic Gold is showing 1 warning sign in our investment analysis , you should know about...
For those who like to find winning investments this free list of growing companies with recent insider purchasing, could be just the ticket.
Please note, the market returns quoted in this article reflect the market weighted average returns of stocks that currently trade on Canadian exchanges.
Have feedback on this article? Concerned about the content? Get in touch with us directly. Alternatively, email editorial-team (at) simplywallst.com.
This article by Simply Wall St is general in nature. We provide commentary based on historical data and analyst forecasts only using an unbiased methodology and our articles are not intended to be financial advice. It does not constitute a recommendation to buy or sell any stock, and does not take account of your objectives, or your financial situation. We aim to bring you long-term focused analysis driven by fundamental data. Note that our analysis may not factor in the latest price-sensitive company announcements or qualitative material. Simply Wall St has no position in any stocks mentioned.