
 Yahoo Finance
 The past year for Henry Boot (LON:BOOT) investors has not been profitable
The simplest way to benefit from a rising market is to buy an index fund. Active investors aim to buy stocks that vastly outperform the market - but in the process, they risk under-performance. Investors in Henry Boot PLC (LON:BOOT) have tasted that bitter downside in the last year, as the share price dropped 28%. That falls noticeably short of the market return of around 8.0%. However, the longer term returns haven't been so bad, with the stock down 11% in the last three years.
Since shareholders are down over the longer term, lets look at the underlying fundamentals over the that time and see if they've been consistent with returns.
Check out our latest analysis for Henry Boot
To quote Buffett, 'Ships will sail around the world but the Flat Earth Society will flourish. There will continue to be wide discrepancies between price and value in the marketplace...' One imperfect but simple way to consider how the market perception of a company has shifted is to compare the change in the earnings per share (EPS) with the share price movement.
During the unfortunate twelve months during which the Henry Boot share price fell, it actually saw its earnings per share (EPS) improve by 18%. Of course, the situation might betray previous over-optimism about growth.
The divergence between the EPS and the share price is quite notable, during the year. So it's easy to justify a look at some other metrics.
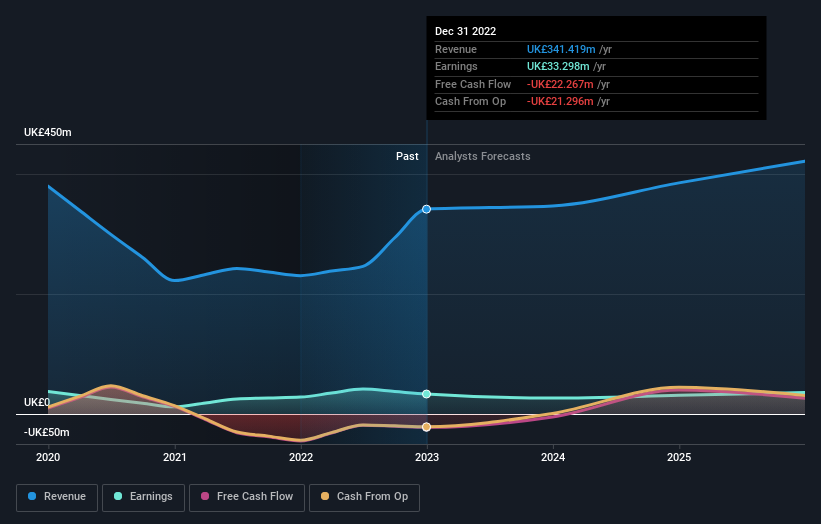
Henry Boot managed to grow revenue over the last year, which is usually a real positive. Since we can't easily explain the share price movement based on these metrics, it might be worth considering how market sentiment has changed towards the stock.
You can see how earnings and revenue have changed over time in the image below (click on the chart to see the exact values).
We know that Henry Boot has improved its bottom line lately, but what does the future have in store? So it makes a lot of sense to check out what analysts think Henry Boot will earn in the future (free profit forecasts).
A Different Perspective
While the broader market gained around 8.0% in the last year, Henry Boot shareholders lost 26% (even including dividends). Even the share prices of good stocks drop sometimes, but we want to see improvements in the fundamental metrics of a business, before getting too interested. Regrettably, last year's performance caps off a bad run, with the shareholders facing a total loss of 2% per year over five years. Generally speaking long term share price weakness can be a bad sign, though contrarian investors might want to research the stock in hope of a turnaround. It's always interesting to track share price performance over the longer term. But to understand Henry Boot better, we need to consider many other factors. For instance, we've identified 1 warning sign for Henry Boot that you should be aware of.
Of course Henry Boot may not be the best stock to buy. So you may wish to see this free collection of growth stocks.
Please note, the market returns quoted in this article reflect the market weighted average returns of stocks that currently trade on British exchanges.
Have feedback on this article? Concerned about the content? Get in touch with us directly. Alternatively, email editorial-team (at) simplywallst.com.
This article by Simply Wall St is general in nature. We provide commentary based on historical data and analyst forecasts only using an unbiased methodology and our articles are not intended to be financial advice. It does not constitute a recommendation to buy or sell any stock, and does not take account of your objectives, or your financial situation. We aim to bring you long-term focused analysis driven by fundamental data. Note that our analysis may not factor in the latest price-sensitive company announcements or qualitative material. Simply Wall St has no position in any stocks mentioned.
Join A Paid User Research Session
You’ll receive a US$30 Amazon Gift card for 1 hour of your time while helping us build better investing tools for the individual investors like yourself. Sign up here
