
 Yahoo Finance
 The past five years for SATS (SGX:S58) investors has not been profitable
SATS Ltd. (SGX:S58) shareholders should be happy to see the share price up 15% in the last quarter. But over the last half decade, the stock has not performed well. After all, the share price is down 40% in that time, significantly under-performing the market.
With that in mind, it's worth seeing if the company's underlying fundamentals have been the driver of long term performance, or if there are some discrepancies.
See our latest analysis for SATS
Because SATS made a loss in the last twelve months, we think the market is probably more focussed on revenue and revenue growth, at least for now. Shareholders of unprofitable companies usually expect strong revenue growth. As you can imagine, fast revenue growth, when maintained, often leads to fast profit growth.
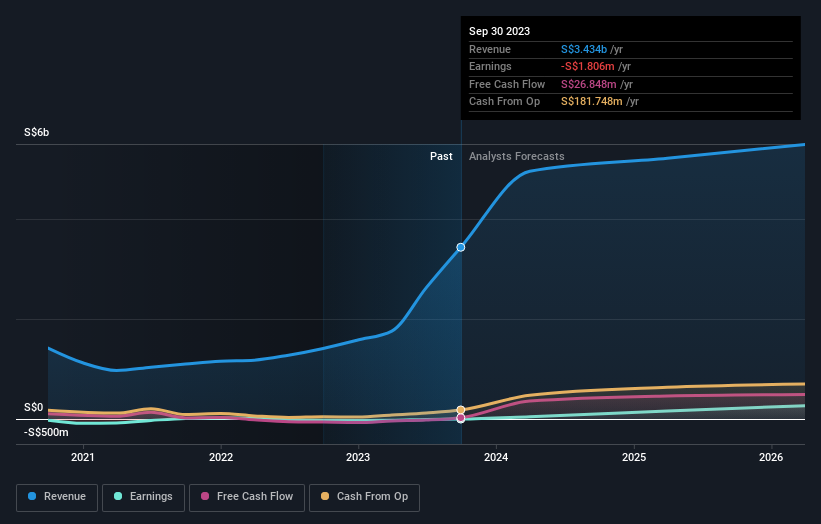
In the last half decade, SATS saw its revenue increase by 3.2% per year. That's not a very high growth rate considering it doesn't make profits. Given the weak growth, the share price fall of 7% isn't particularly surprising. The key question is whether the company can make it to profitability, and beyond, without trouble. Shareholders will want the company to approach profitability if it can't grow revenue any faster.
The company's revenue and earnings (over time) are depicted in the image below (click to see the exact numbers).
Take a more thorough look at SATS' financial health with this free report on its balance sheet.
What About The Total Shareholder Return (TSR)?
We'd be remiss not to mention the difference between SATS' total shareholder return (TSR) and its share price return. Arguably the TSR is a more complete return calculation because it accounts for the value of dividends (as if they were reinvested), along with the hypothetical value of any discounted capital that have been offered to shareholders. Its history of dividend payouts mean that SATS' TSR, which was a 34% drop over the last 5 years, was not as bad as the share price return.
A Different Perspective
It's good to see that SATS has rewarded shareholders with a total shareholder return of 3.2% in the last twelve months. Notably the five-year annualised TSR loss of 6% per year compares very unfavourably with the recent share price performance. The long term loss makes us cautious, but the short term TSR gain certainly hints at a brighter future. I find it very interesting to look at share price over the long term as a proxy for business performance. But to truly gain insight, we need to consider other information, too. For example, we've discovered 2 warning signs for SATS (1 shouldn't be ignored!) that you should be aware of before investing here.
Of course SATS may not be the best stock to buy. So you may wish to see this free collection of growth stocks.
Please note, the market returns quoted in this article reflect the market weighted average returns of stocks that currently trade on Singaporean exchanges.
Have feedback on this article? Concerned about the content? Get in touch with us directly. Alternatively, email editorial-team (at) simplywallst.com.
This article by Simply Wall St is general in nature. We provide commentary based on historical data and analyst forecasts only using an unbiased methodology and our articles are not intended to be financial advice. It does not constitute a recommendation to buy or sell any stock, and does not take account of your objectives, or your financial situation. We aim to bring you long-term focused analysis driven by fundamental data. Note that our analysis may not factor in the latest price-sensitive company announcements or qualitative material. Simply Wall St has no position in any stocks mentioned.
