
 Yahoo Finance
 The past five years for Red Cat Holdings (NASDAQ:RCAT) investors has not been profitable
Red Cat Holdings, Inc. (NASDAQ:RCAT) shareholders will doubtless be very grateful to see the share price up 44% in the last quarter. But will that heal all the wounds inflicted over 5 years of declines? Unlikely. Indeed, the share price is down a whopping 70% in that time. While the recent increase might be a green shoot, we're certainly hesitant to rejoice. The real question is whether the business can leave its past behind and improve itself over the years ahead.
Since shareholders are down over the longer term, lets look at the underlying fundamentals over the that time and see if they've been consistent with returns.
Check out our latest analysis for Red Cat Holdings
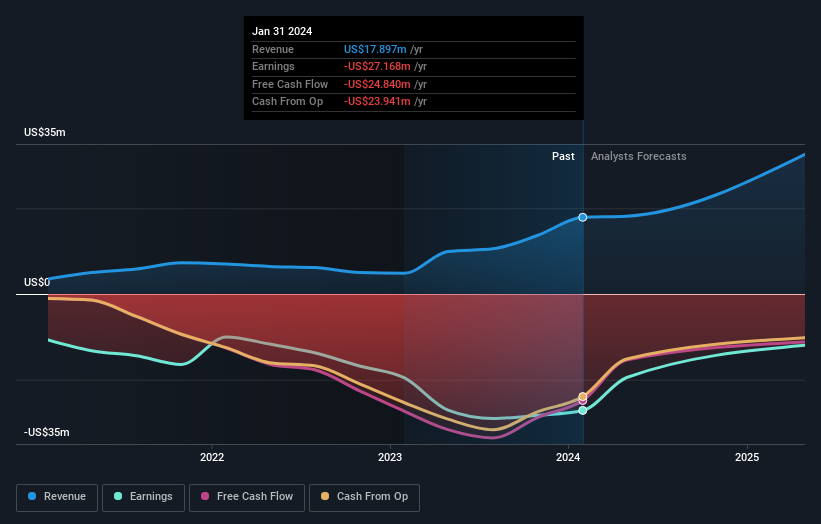
Given that Red Cat Holdings didn't make a profit in the last twelve months, we'll focus on revenue growth to form a quick view of its business development. Shareholders of unprofitable companies usually desire strong revenue growth. That's because it's hard to be confident a company will be sustainable if revenue growth is negligible, and it never makes a profit.
Over five years, Red Cat Holdings grew its revenue at 57% per year. That's better than most loss-making companies. So on the face of it we're really surprised to see the share price has averaged a fall of 11% each year, in the same time period. It could be that the stock was over-hyped before. While there might be an opportunity here, you'd want to take a close look at the balance sheet strength.
The image below shows how earnings and revenue have tracked over time (if you click on the image you can see greater detail).
You can see how its balance sheet has strengthened (or weakened) over time in this free interactive graphic.
A Different Perspective
Red Cat Holdings shareholders are down 9.4% for the year, but the market itself is up 23%. However, keep in mind that even the best stocks will sometimes underperform the market over a twelve month period. Unfortunately, longer term shareholders are suffering worse, given the loss of 11% doled out over the last five years. We would want clear information suggesting the company will grow, before taking the view that the share price will stabilize. While it is well worth considering the different impacts that market conditions can have on the share price, there are other factors that are even more important. Case in point: We've spotted 5 warning signs for Red Cat Holdings you should be aware of, and 2 of them are a bit concerning.
If you like to buy stocks alongside management, then you might just love this free list of companies. (Hint: many of them are unnoticed AND have attractive valuation).
Please note, the market returns quoted in this article reflect the market weighted average returns of stocks that currently trade on American exchanges.
Have feedback on this article? Concerned about the content? Get in touch with us directly. Alternatively, email editorial-team (at) simplywallst.com.
This article by Simply Wall St is general in nature. We provide commentary based on historical data and analyst forecasts only using an unbiased methodology and our articles are not intended to be financial advice. It does not constitute a recommendation to buy or sell any stock, and does not take account of your objectives, or your financial situation. We aim to bring you long-term focused analysis driven by fundamental data. Note that our analysis may not factor in the latest price-sensitive company announcements or qualitative material. Simply Wall St has no position in any stocks mentioned.
Have feedback on this article? Concerned about the content? Get in touch with us directly. Alternatively, email editorial-team@simplywallst.com
