
 Yahoo Finance
 The past five years for Direct Line Insurance Group (LON:DLG) investors has not been profitable
Direct Line Insurance Group plc (LON:DLG) shareholders should be happy to see the share price up 11% in the last month. But if you look at the last five years the returns have not been good. After all, the share price is down 38% in that time, significantly under-performing the market.
So let's have a look and see if the longer term performance of the company has been in line with the underlying business' progress.
See our latest analysis for Direct Line Insurance Group
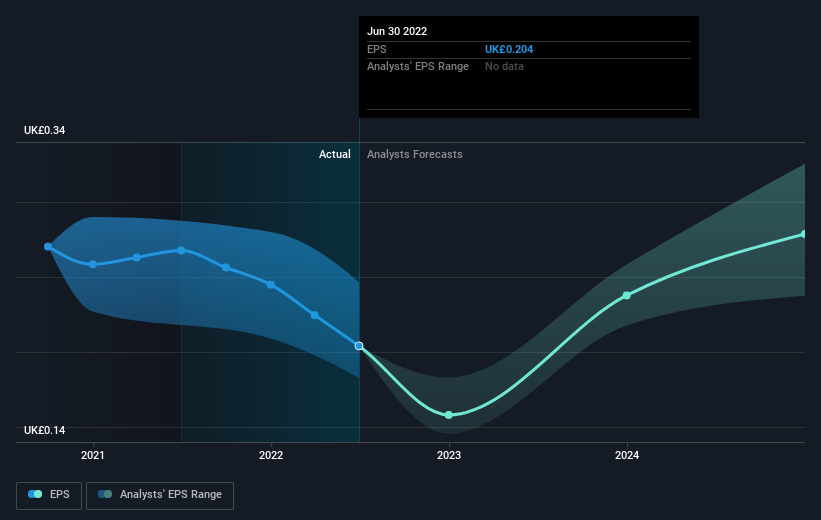
In his essay The Superinvestors of Graham-and-Doddsville Warren Buffett described how share prices do not always rationally reflect the value of a business. One way to examine how market sentiment has changed over time is to look at the interaction between a company's share price and its earnings per share (EPS).
During the five years over which the share price declined, Direct Line Insurance Group's earnings per share (EPS) dropped by 2.3% each year. Readers should note that the share price has fallen faster than the EPS, at a rate of 9% per year, over the period. This implies that the market is more cautious about the business these days. The less favorable sentiment is reflected in its current P/E ratio of 10.81.
The image below shows how EPS has tracked over time (if you click on the image you can see greater detail).
It might be well worthwhile taking a look at our free report on Direct Line Insurance Group's earnings, revenue and cash flow.
What About Dividends?
When looking at investment returns, it is important to consider the difference between total shareholder return (TSR) and share price return. The TSR incorporates the value of any spin-offs or discounted capital raisings, along with any dividends, based on the assumption that the dividends are reinvested. Arguably, the TSR gives a more comprehensive picture of the return generated by a stock. We note that for Direct Line Insurance Group the TSR over the last 5 years was -6.7%, which is better than the share price return mentioned above. The dividends paid by the company have thusly boosted the total shareholder return.
A Different Perspective
We regret to report that Direct Line Insurance Group shareholders are down 7.1% for the year (even including dividends). Unfortunately, that's worse than the broader market decline of 1.6%. However, it could simply be that the share price has been impacted by broader market jitters. It might be worth keeping an eye on the fundamentals, in case there's a good opportunity. Unfortunately, last year's performance may indicate unresolved challenges, given that it was worse than the annualised loss of 1.3% over the last half decade. Generally speaking long term share price weakness can be a bad sign, though contrarian investors might want to research the stock in hope of a turnaround. While it is well worth considering the different impacts that market conditions can have on the share price, there are other factors that are even more important. For example, we've discovered 1 warning sign for Direct Line Insurance Group that you should be aware of before investing here.
Of course, you might find a fantastic investment by looking elsewhere. So take a peek at this free list of companies we expect will grow earnings.
Please note, the market returns quoted in this article reflect the market weighted average returns of stocks that currently trade on GB exchanges.
Have feedback on this article? Concerned about the content? Get in touch with us directly. Alternatively, email editorial-team (at) simplywallst.com.
This article by Simply Wall St is general in nature. We provide commentary based on historical data and analyst forecasts only using an unbiased methodology and our articles are not intended to be financial advice. It does not constitute a recommendation to buy or sell any stock, and does not take account of your objectives, or your financial situation. We aim to bring you long-term focused analysis driven by fundamental data. Note that our analysis may not factor in the latest price-sensitive company announcements or qualitative material. Simply Wall St has no position in any stocks mentioned.
Join A Paid User Research Session
You’ll receive a US$30 Amazon Gift card for 1 hour of your time while helping us build better investing tools for the individual investors like yourself. Sign up here
