
 Yahoo Finance
 The past five years for Canacol Energy (TSE:CNE) investors has not been profitable
Generally speaking long term investing is the way to go. But along the way some stocks are going to perform badly. For example the Canacol Energy Ltd (TSE:CNE) share price dropped 75% over five years. That's not a lot of fun for true believers. And we doubt long term believers are the only worried holders, since the stock price has declined 47% over the last twelve months. Shareholders have had an even rougher run lately, with the share price down 11% in the last 90 days.
So let's have a look and see if the longer term performance of the company has been in line with the underlying business' progress.
View our latest analysis for Canacol Energy
To quote Buffett, 'Ships will sail around the world but the Flat Earth Society will flourish. There will continue to be wide discrepancies between price and value in the marketplace...' One flawed but reasonable way to assess how sentiment around a company has changed is to compare the earnings per share (EPS) with the share price.
During five years of share price growth, Canacol Energy moved from a loss to profitability. That would generally be considered a positive, so we are surprised to see the share price is down. Other metrics may better explain the share price move.
We note that the dividend has remained healthy, so that wouldn't really explain the share price drop. While it's not completely obvious why the share price is down, a closer look at the company's history might help explain it.
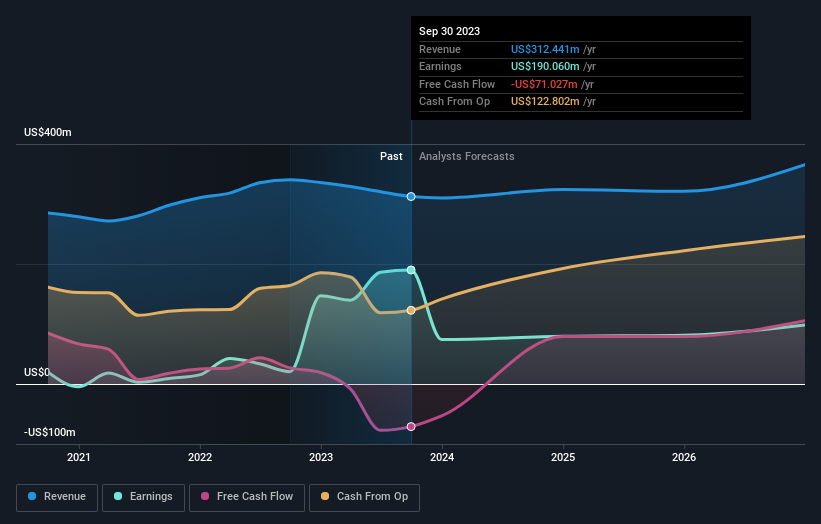
The image below shows how earnings and revenue have tracked over time (if you click on the image you can see greater detail).
We know that Canacol Energy has improved its bottom line over the last three years, but what does the future have in store? You can see how its balance sheet has strengthened (or weakened) over time in this free interactive graphic.
What About Dividends?
When looking at investment returns, it is important to consider the difference between total shareholder return (TSR) and share price return. The TSR is a return calculation that accounts for the value of cash dividends (assuming that any dividend received was reinvested) and the calculated value of any discounted capital raisings and spin-offs. Arguably, the TSR gives a more comprehensive picture of the return generated by a stock. As it happens, Canacol Energy's TSR for the last 5 years was -65%, which exceeds the share price return mentioned earlier. This is largely a result of its dividend payments!
A Different Perspective
Investors in Canacol Energy had a tough year, with a total loss of 41% (including dividends), against a market gain of about 13%. Even the share prices of good stocks drop sometimes, but we want to see improvements in the fundamental metrics of a business, before getting too interested. Regrettably, last year's performance caps off a bad run, with the shareholders facing a total loss of 11% per year over five years. Generally speaking long term share price weakness can be a bad sign, though contrarian investors might want to research the stock in hope of a turnaround. It's always interesting to track share price performance over the longer term. But to understand Canacol Energy better, we need to consider many other factors. To that end, you should learn about the 4 warning signs we've spotted with Canacol Energy (including 2 which are potentially serious) .
If you are like me, then you will not want to miss this free list of growing companies that insiders are buying.
Please note, the market returns quoted in this article reflect the market weighted average returns of stocks that currently trade on Canadian exchanges.
Have feedback on this article? Concerned about the content? Get in touch with us directly. Alternatively, email editorial-team (at) simplywallst.com.
This article by Simply Wall St is general in nature. We provide commentary based on historical data and analyst forecasts only using an unbiased methodology and our articles are not intended to be financial advice. It does not constitute a recommendation to buy or sell any stock, and does not take account of your objectives, or your financial situation. We aim to bring you long-term focused analysis driven by fundamental data. Note that our analysis may not factor in the latest price-sensitive company announcements or qualitative material. Simply Wall St has no position in any stocks mentioned.
