
 Yahoo Finance
 The past five years for Ambac Financial Group (NYSE:AMBC) investors has not been profitable
The main aim of stock picking is to find the market-beating stocks. But in any portfolio, there will be mixed results between individual stocks. So we wouldn't blame long term Ambac Financial Group, Inc. (NYSE:AMBC) shareholders for doubting their decision to hold, with the stock down 24% over a half decade. The falls have accelerated recently, with the share price down 12% in the last three months.
Now let's have a look at the company's fundamentals, and see if the long term shareholder return has matched the performance of the underlying business.
Check out our latest analysis for Ambac Financial Group
While the efficient markets hypothesis continues to be taught by some, it has been proven that markets are over-reactive dynamic systems, and investors are not always rational. By comparing earnings per share (EPS) and share price changes over time, we can get a feel for how investor attitudes to a company have morphed over time.
During five years of share price growth, Ambac Financial Group moved from a loss to profitability. Most would consider that to be a good thing, so it's counter-intuitive to see the share price declining. Other metrics may better explain the share price move.
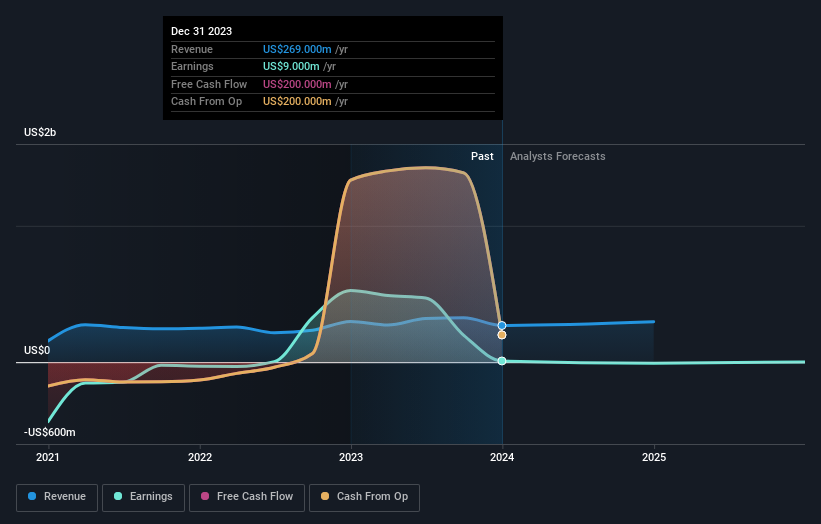
It could be that the revenue decline of 7.8% per year is viewed as evidence that Ambac Financial Group is shrinking. This has probably encouraged some shareholders to sell down the stock.
You can see below how earnings and revenue have changed over time (discover the exact values by clicking on the image).
It is of course excellent to see how Ambac Financial Group has grown profits over the years, but the future is more important for shareholders. If you are thinking of buying or selling Ambac Financial Group stock, you should check out this FREE detailed report on its balance sheet.
A Different Perspective
Ambac Financial Group shareholders are down 6.8% for the year, but the market itself is up 23%. However, keep in mind that even the best stocks will sometimes underperform the market over a twelve month period. Regrettably, last year's performance caps off a bad run, with the shareholders facing a total loss of 4% per year over five years. Generally speaking long term share price weakness can be a bad sign, though contrarian investors might want to research the stock in hope of a turnaround. It's always interesting to track share price performance over the longer term. But to understand Ambac Financial Group better, we need to consider many other factors. For instance, we've identified 3 warning signs for Ambac Financial Group (2 can't be ignored) that you should be aware of.
Of course Ambac Financial Group may not be the best stock to buy. So you may wish to see this free collection of growth stocks.
Please note, the market returns quoted in this article reflect the market weighted average returns of stocks that currently trade on American exchanges.
Have feedback on this article? Concerned about the content? Get in touch with us directly. Alternatively, email editorial-team (at) simplywallst.com.
This article by Simply Wall St is general in nature. We provide commentary based on historical data and analyst forecasts only using an unbiased methodology and our articles are not intended to be financial advice. It does not constitute a recommendation to buy or sell any stock, and does not take account of your objectives, or your financial situation. We aim to bring you long-term focused analysis driven by fundamental data. Note that our analysis may not factor in the latest price-sensitive company announcements or qualitative material. Simply Wall St has no position in any stocks mentioned.
