
 Yahoo Finance
 The past year for Citi Trends (NASDAQ:CTRN) investors has not been profitable
As every investor would know, you don't hit a homerun every time you swing. But serious investors should think long and hard about avoiding extreme losses. It must have been painful to be a Citi Trends, Inc. (NASDAQ:CTRN) shareholder over the last year, since the stock price plummeted 73% in that time. That'd be enough to make even the strongest stomachs churn. On the other hand, the stock is actually up 47% over three years. Furthermore, it's down 31% in about a quarter. That's not much fun for holders. But this could be related to the weak market, which is down 15% in the same period.
With that in mind, it's worth seeing if the company's underlying fundamentals have been the driver of long term performance, or if there are some discrepancies.
See our latest analysis for Citi Trends
While the efficient markets hypothesis continues to be taught by some, it has been proven that markets are over-reactive dynamic systems, and investors are not always rational. One imperfect but simple way to consider how the market perception of a company has shifted is to compare the change in the earnings per share (EPS) with the share price movement.
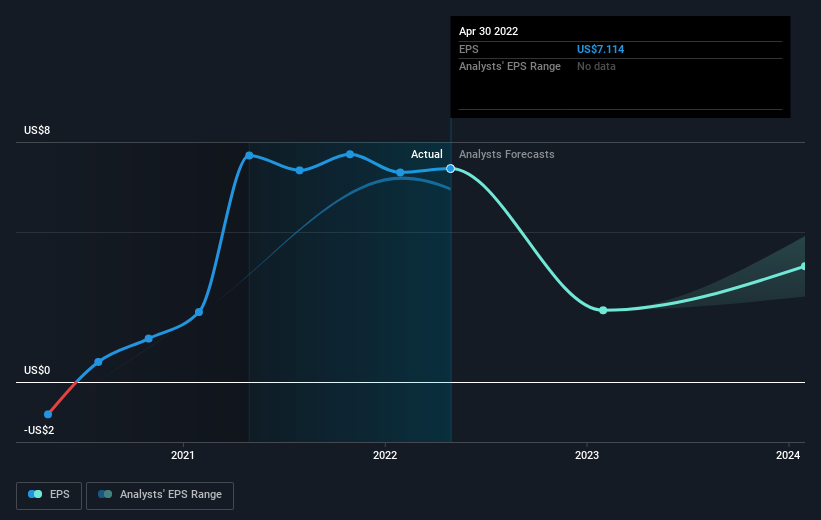
Unhappily, Citi Trends had to report a 5.1% decline in EPS over the last year. The share price decline of 73% is actually more than the EPS drop. So it seems the market was too confident about the business, a year ago. The P/E ratio of 3.06 also points to the negative market sentiment.
The image below shows how EPS has tracked over time (if you click on the image you can see greater detail).
We consider it positive that insiders have made significant purchases in the last year. Having said that, most people consider earnings and revenue growth trends to be a more meaningful guide to the business. It might be well worthwhile taking a look at our free report on Citi Trends' earnings, revenue and cash flow.
A Different Perspective
While the broader market lost about 18% in the twelve months, Citi Trends shareholders did even worse, losing 73%. However, it could simply be that the share price has been impacted by broader market jitters. It might be worth keeping an eye on the fundamentals, in case there's a good opportunity. Longer term investors wouldn't be so upset, since they would have made 2%, each year, over five years. It could be that the recent sell-off is an opportunity, so it may be worth checking the fundamental data for signs of a long term growth trend. While it is well worth considering the different impacts that market conditions can have on the share price, there are other factors that are even more important. To that end, you should be aware of the 2 warning signs we've spotted with Citi Trends .
Citi Trends is not the only stock insiders are buying. So take a peek at this free list of growing companies with insider buying.
Please note, the market returns quoted in this article reflect the market weighted average returns of stocks that currently trade on US exchanges.
Have feedback on this article? Concerned about the content? Get in touch with us directly. Alternatively, email editorial-team (at) simplywallst.com.
This article by Simply Wall St is general in nature. We provide commentary based on historical data and analyst forecasts only using an unbiased methodology and our articles are not intended to be financial advice. It does not constitute a recommendation to buy or sell any stock, and does not take account of your objectives, or your financial situation. We aim to bring you long-term focused analysis driven by fundamental data. Note that our analysis may not factor in the latest price-sensitive company announcements or qualitative material. Simply Wall St has no position in any stocks mentioned.
Join A Paid User Research Session
You’ll receive a US$30 Amazon Gift card for 1 hour of your time while helping us build better investing tools for the individual investors like yourself. Sign up here
