
 Yahoo Finance
 The past year for Aptitude Software Group (LON:APTD) investors has not been profitable
Passive investing in an index fund is a good way to ensure your own returns roughly match the overall market. But if you buy individual stocks, you can do both better or worse than that. Investors in Aptitude Software Group plc (LON:APTD) have tasted that bitter downside in the last year, as the share price dropped 46%. That falls noticeably short of the market decline of around 1.1%. We note that it has not been easy for shareholders over three years, either; the share price is down 34% in that time. Furthermore, it's down 14% in about a quarter. That's not much fun for holders.
It's worthwhile assessing if the company's economics have been moving in lockstep with these underwhelming shareholder returns, or if there is some disparity between the two. So let's do just that.
Check out our latest analysis for Aptitude Software Group
There is no denying that markets are sometimes efficient, but prices do not always reflect underlying business performance. One way to examine how market sentiment has changed over time is to look at the interaction between a company's share price and its earnings per share (EPS).
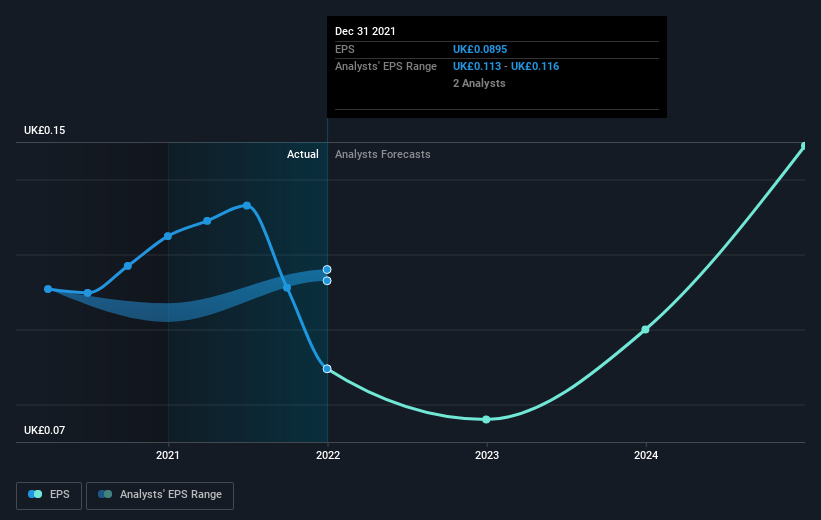
Unhappily, Aptitude Software Group had to report a 28% decline in EPS over the last year. The share price decline of 46% is actually more than the EPS drop. So it seems the market was too confident about the business, a year ago.
The graphic below depicts how EPS has changed over time (unveil the exact values by clicking on the image).
It's good to see that there was some significant insider buying in the last three months. That's a positive. That said, we think earnings and revenue growth trends are even more important factors to consider. This free interactive report on Aptitude Software Group's earnings, revenue and cash flow is a great place to start, if you want to investigate the stock further.
A Different Perspective
Aptitude Software Group shareholders are down 45% for the year (even including dividends), but the market itself is up 1.1%. Even the share prices of good stocks drop sometimes, but we want to see improvements in the fundamental metrics of a business, before getting too interested. On the bright side, long term shareholders have made money, with a gain of 2% per year over half a decade. If the fundamental data continues to indicate long term sustainable growth, the current sell-off could be an opportunity worth considering. It's always interesting to track share price performance over the longer term. But to understand Aptitude Software Group better, we need to consider many other factors. Case in point: We've spotted 3 warning signs for Aptitude Software Group you should be aware of.
If you like to buy stocks alongside management, then you might just love this free list of companies. (Hint: insiders have been buying them).
Please note, the market returns quoted in this article reflect the market weighted average returns of stocks that currently trade on GB exchanges.
Have feedback on this article? Concerned about the content? Get in touch with us directly. Alternatively, email editorial-team (at) simplywallst.com.
This article by Simply Wall St is general in nature. We provide commentary based on historical data and analyst forecasts only using an unbiased methodology and our articles are not intended to be financial advice. It does not constitute a recommendation to buy or sell any stock, and does not take account of your objectives, or your financial situation. We aim to bring you long-term focused analysis driven by fundamental data. Note that our analysis may not factor in the latest price-sensitive company announcements or qualitative material. Simply Wall St has no position in any stocks mentioned.
