
 Yahoo Finance
 Parkland (TSE:PKI) stock performs better than its underlying earnings growth over last five years
When you buy and hold a stock for the long term, you definitely want it to provide a positive return. But more than that, you probably want to see it rise more than the market average. Unfortunately for shareholders, while the Parkland Corporation (TSE:PKI) share price is up 22% in the last five years, that's less than the market return. The last year hasn't been great either, with the stock up just 2.3%.
Since the stock has added CA$231m to its market cap in the past week alone, let's see if underlying performance has been driving long-term returns.
See our latest analysis for Parkland
There is no denying that markets are sometimes efficient, but prices do not always reflect underlying business performance. One flawed but reasonable way to assess how sentiment around a company has changed is to compare the earnings per share (EPS) with the share price.
Over half a decade, Parkland managed to grow its earnings per share at 1.1% a year. This EPS growth is lower than the 4% average annual increase in the share price. So it's fair to assume the market has a higher opinion of the business than it did five years ago. That's not necessarily surprising considering the five-year track record of earnings growth. This optimism is visible in its fairly high P/E ratio of 55.25.
The company's earnings per share (over time) is depicted in the image below (click to see the exact numbers).
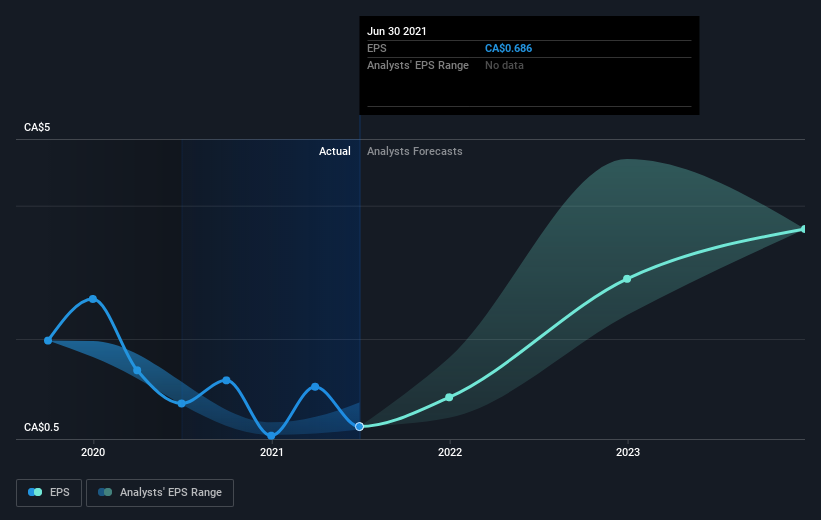
It might be well worthwhile taking a look at our free report on Parkland's earnings, revenue and cash flow.
What About Dividends?
When looking at investment returns, it is important to consider the difference between total shareholder return (TSR) and share price return. Whereas the share price return only reflects the change in the share price, the TSR includes the value of dividends (assuming they were reinvested) and the benefit of any discounted capital raising or spin-off. Arguably, the TSR gives a more comprehensive picture of the return generated by a stock. In the case of Parkland, it has a TSR of 45% for the last 5 years. That exceeds its share price return that we previously mentioned. This is largely a result of its dividend payments!
A Different Perspective
Parkland shareholders are up 5.6% for the year (even including dividends). But that was short of the market average. On the bright side, the longer term returns (running at about 8% a year, over half a decade) look better. Maybe the share price is just taking a breather while the business executes on its growth strategy. While it is well worth considering the different impacts that market conditions can have on the share price, there are other factors that are even more important. Like risks, for instance. Every company has them, and we've spotted 4 warning signs for Parkland (of which 1 makes us a bit uncomfortable!) you should know about.
If you are like me, then you will not want to miss this free list of growing companies that insiders are buying.
Please note, the market returns quoted in this article reflect the market weighted average returns of stocks that currently trade on CA exchanges.
This article by Simply Wall St is general in nature. We provide commentary based on historical data and analyst forecasts only using an unbiased methodology and our articles are not intended to be financial advice. It does not constitute a recommendation to buy or sell any stock, and does not take account of your objectives, or your financial situation. We aim to bring you long-term focused analysis driven by fundamental data. Note that our analysis may not factor in the latest price-sensitive company announcements or qualitative material. Simply Wall St has no position in any stocks mentioned.
Have feedback on this article? Concerned about the content? Get in touch with us directly. Alternatively, email editorial-team (at) simplywallst.com.
